import polars as pl
import plotnine as p9
from plotnine import ggplot, aes
from plotnine.data import huron, mpgScales, Legends, and Guides
This notebook adapts the plotnine guide on scales, legends, and guides to the fluent API style. Where the original page uses pandas for small example tables, this version uses Polars.
Setup
mpg = pl.from_pandas(mpg)
huron = pl.from_pandas(huron)

mpg.head()
shape: (5, 11)
| manufacturer | model | displ | year | cyl | trans | drv | cty | hwy | fl | class |
|---|---|---|---|---|---|---|---|---|---|---|
| str | str | f64 | i64 | i64 | str | str | i64 | i64 | str | str |
| "audi" | "a4" | 1.8 | 1999 | 4 | "auto(l5)" | "f" | 18 | 29 | "p" | "compact" |
| "audi" | "a4" | 1.8 | 1999 | 4 | "manual(m5)" | "f" | 21 | 29 | "p" | "compact" |
| "audi" | "a4" | 2.0 | 2008 | 4 | "manual(m6)" | "f" | 20 | 31 | "p" | "compact" |
| "audi" | "a4" | 2.0 | 2008 | 4 | "auto(av)" | "f" | 21 | 30 | "p" | "compact" |
| "audi" | "a4" | 2.8 | 1999 | 6 | "auto(l5)" | "f" | 16 | 26 | "p" | "compact" |
Scale Basics
Manual Color Mapping
(
    ggplot(mpg)
    .aes("displ", "hwy", color="class")
    .geom_point()
    .scale_color_manual(
        name="Car class",
        breaks=["2seater", "compact"],
        values=["red", "blue"],
    )
)
/Users/iangow/git/plotnine-fluid/.venv/lib/python3.14/site-packages/plotnine/scales/scale_manual.py:45: PlotnineWarning: The palette of scale_color_manual can return a maximum of 2 values. 7 were requested from it.
/Users/iangow/git/plotnine-fluid/.venv/lib/python3.14/site-packages/plotnine/scales/scale_manual.py:45: PlotnineWarning: The palette of scale_color_manual can return a maximum of 2 values. 7 were requested from it.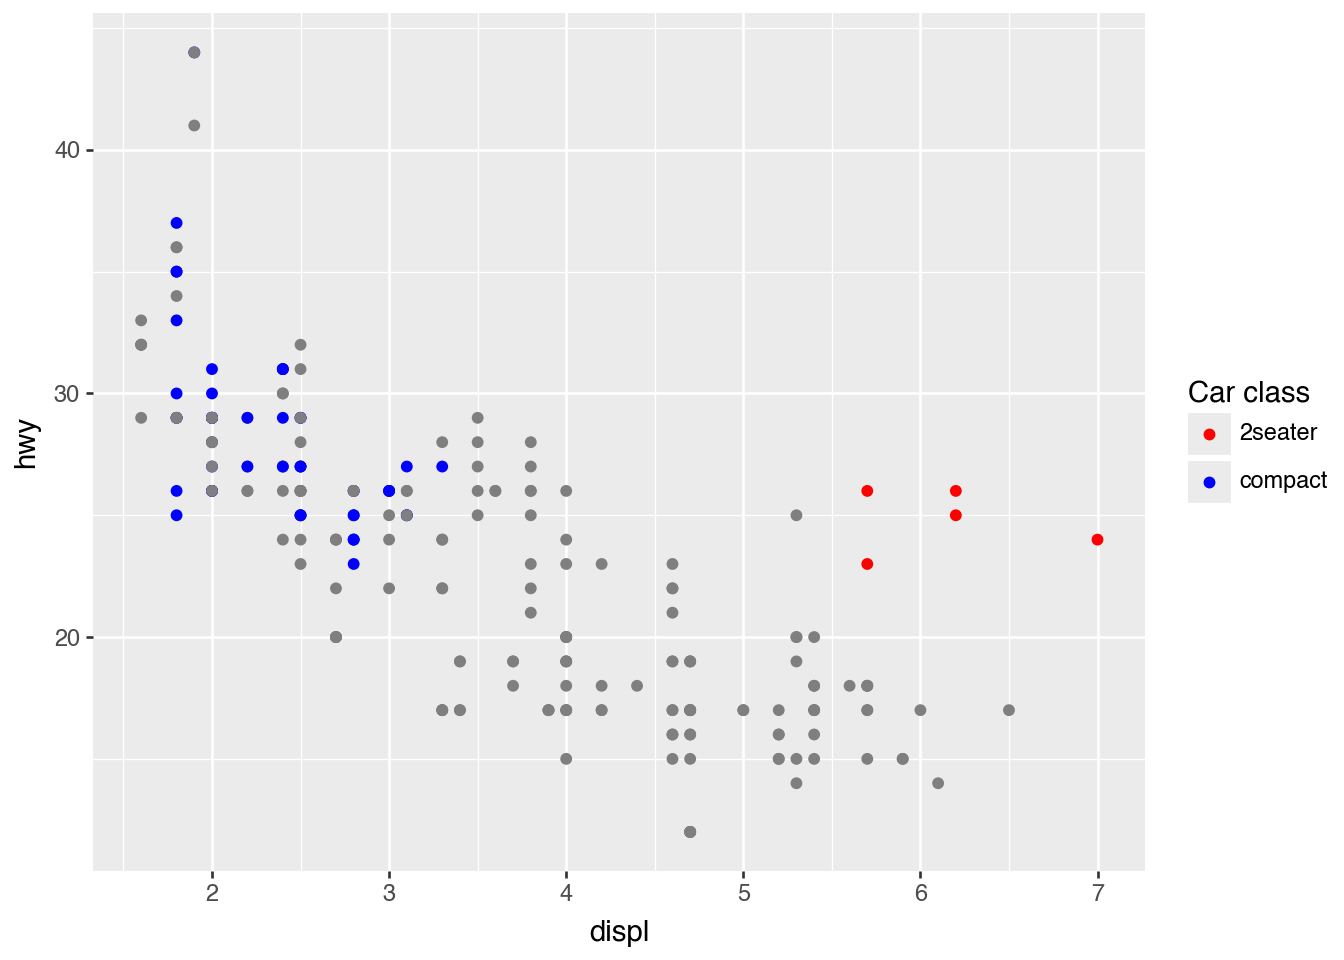
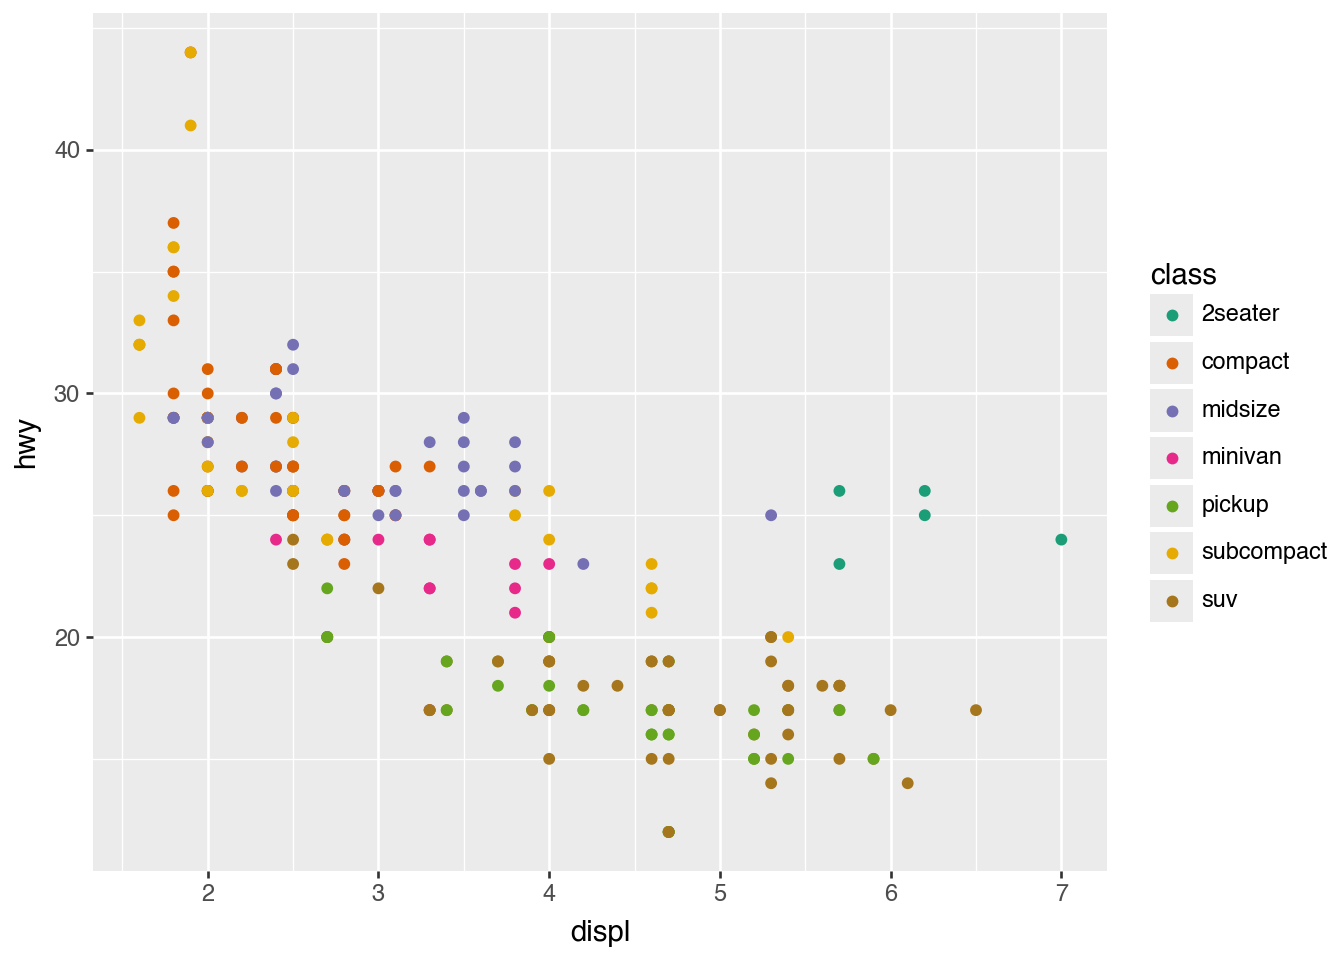
ColorBrewer Palette
(
    ggplot(mpg)
    .aes("displ", "hwy", color="class")
    .geom_point()
    .scale_color_brewer(type="qual", palette=2)
)
Varieties of Scales
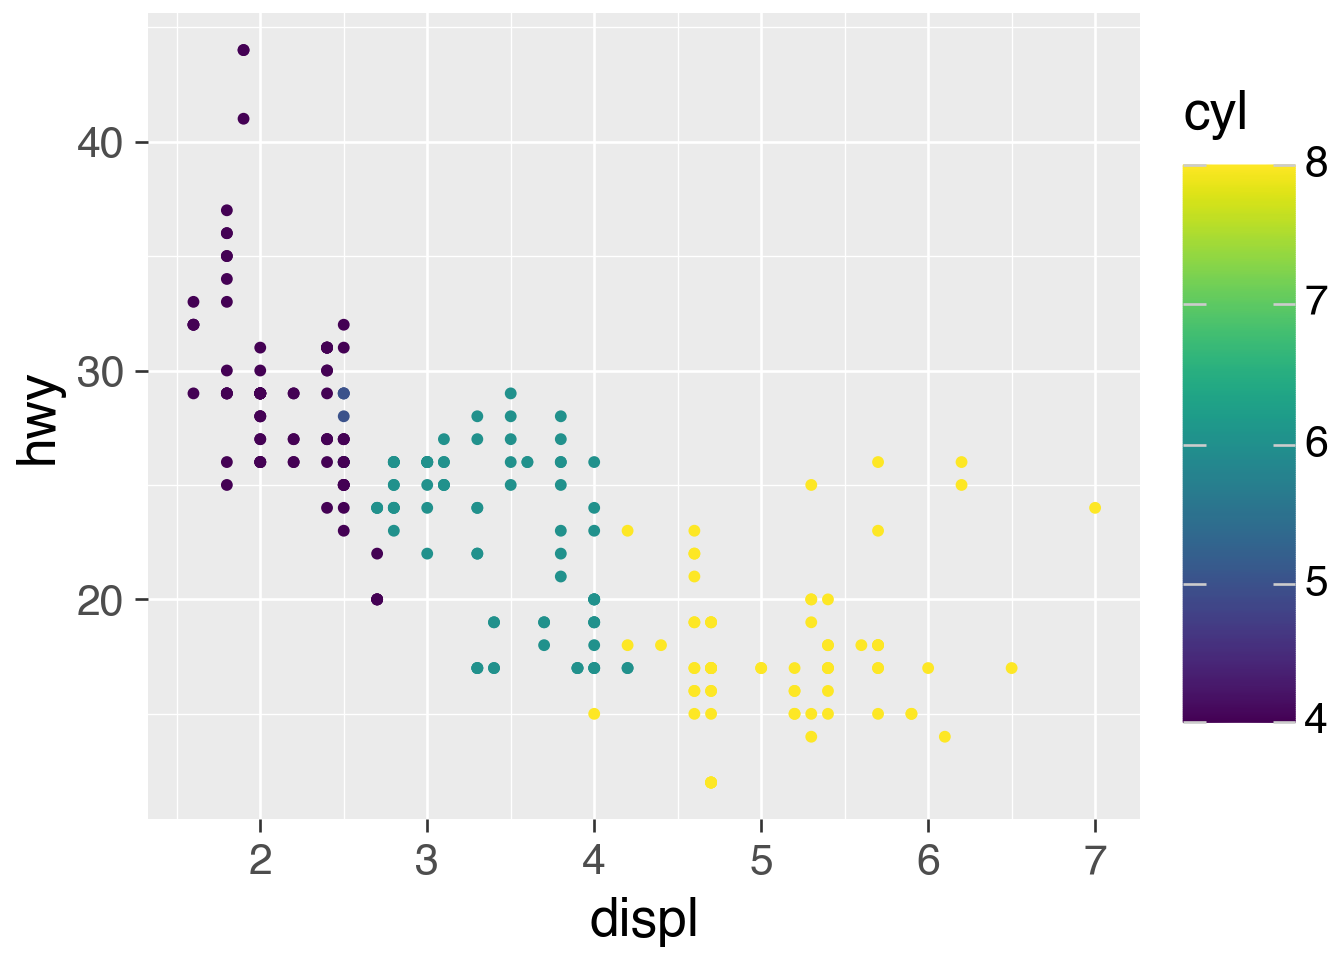
Default Continuous and Discrete Color Scales
base_plot = ggplot(mpg).aes("displ", "hwy").theme_grey(base_size=20)

(
    base_plot
    .geom_point(aes(color="cyl"))
)
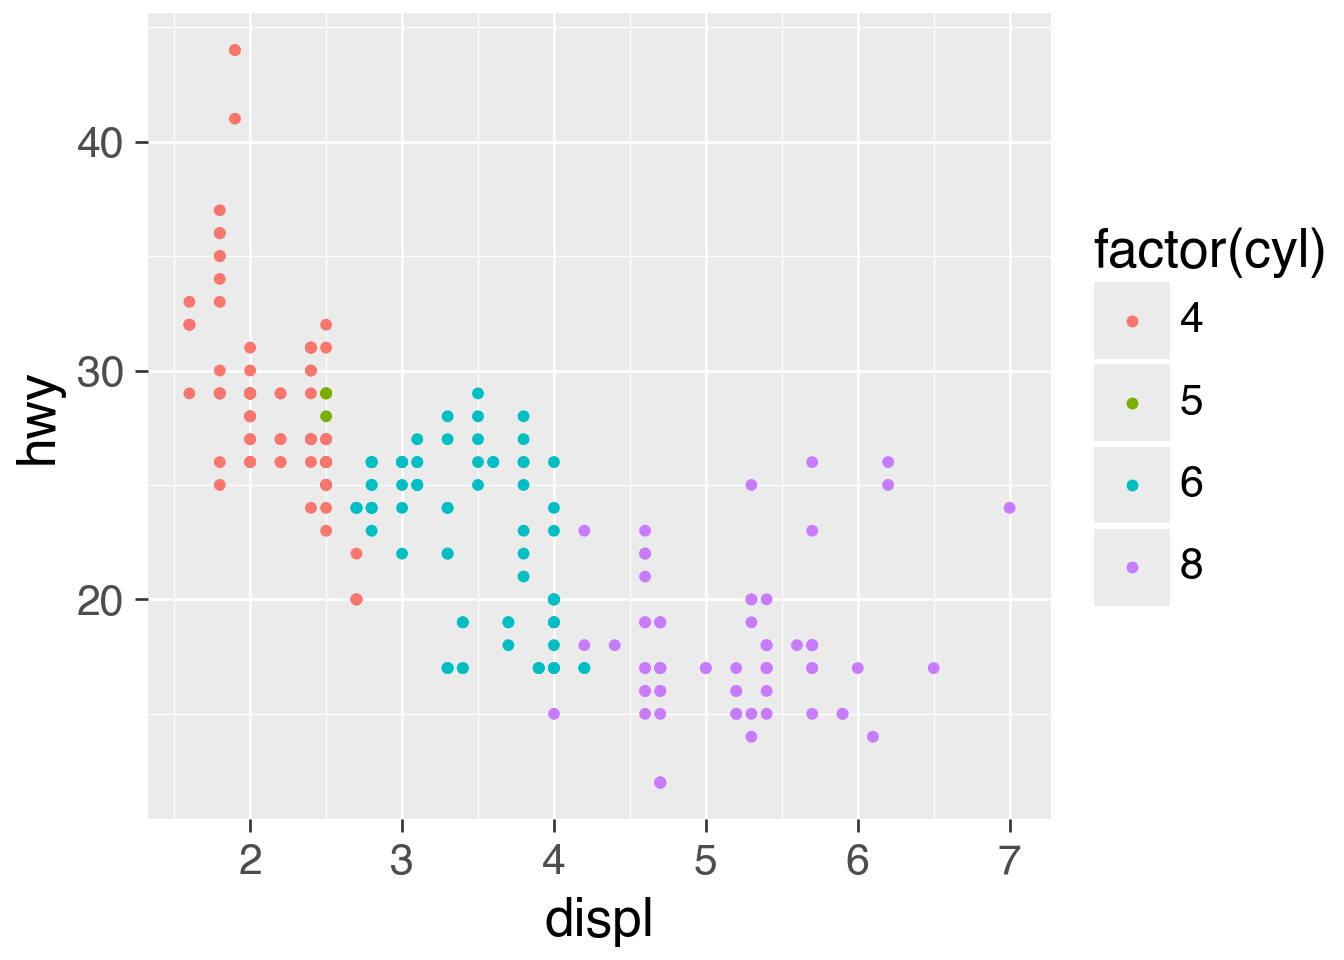
(
    base_plot
    .geom_point(aes(color="factor(cyl)"))
)
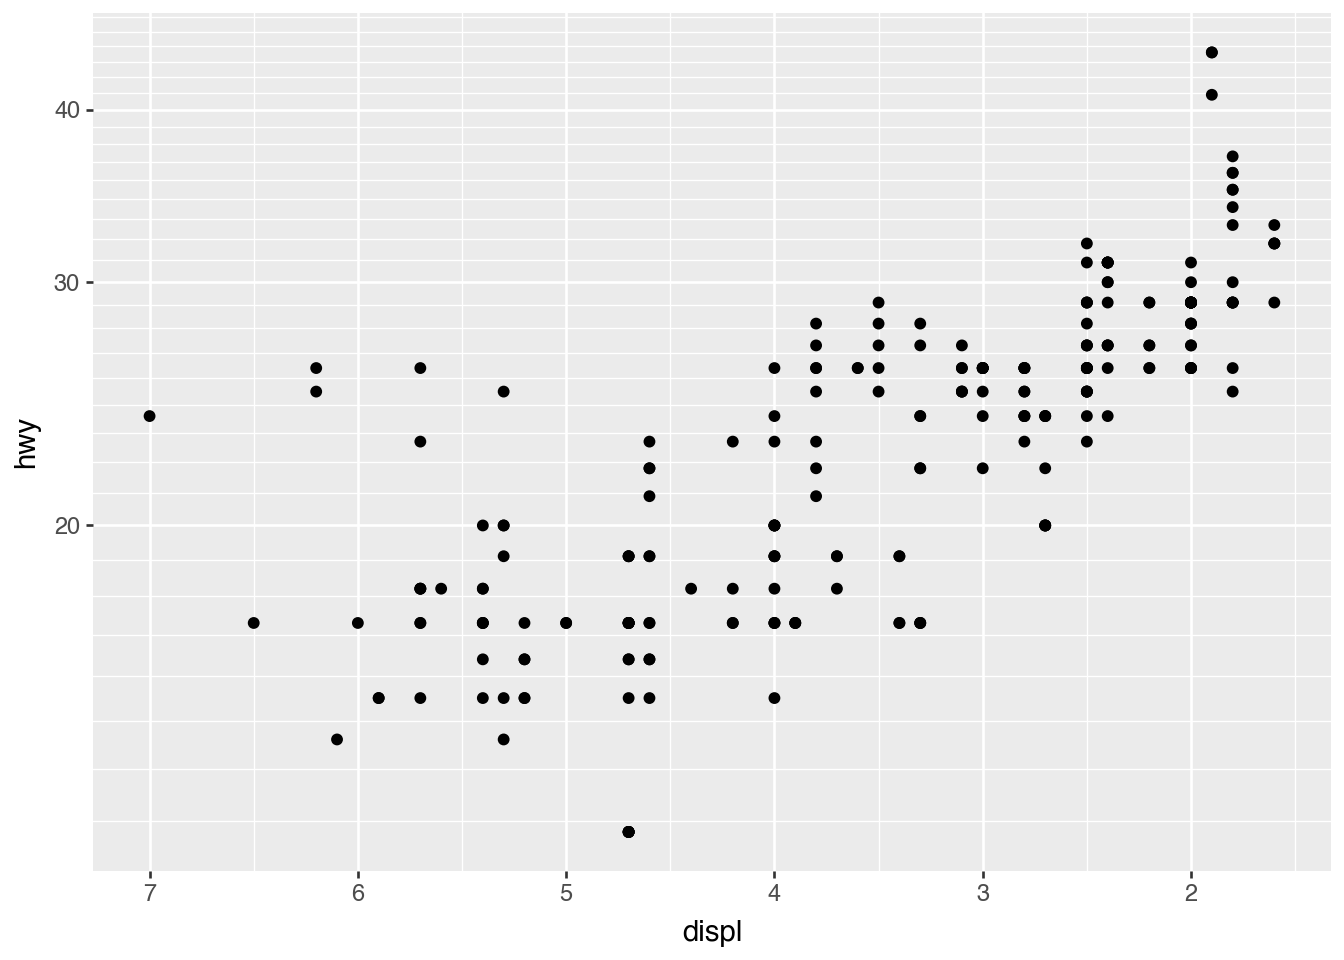
Position Scales
(
    ggplot(mpg)
    .aes("displ", "hwy")
    .geom_point()
    .scale_x_reverse()
    .scale_y_log10()
)
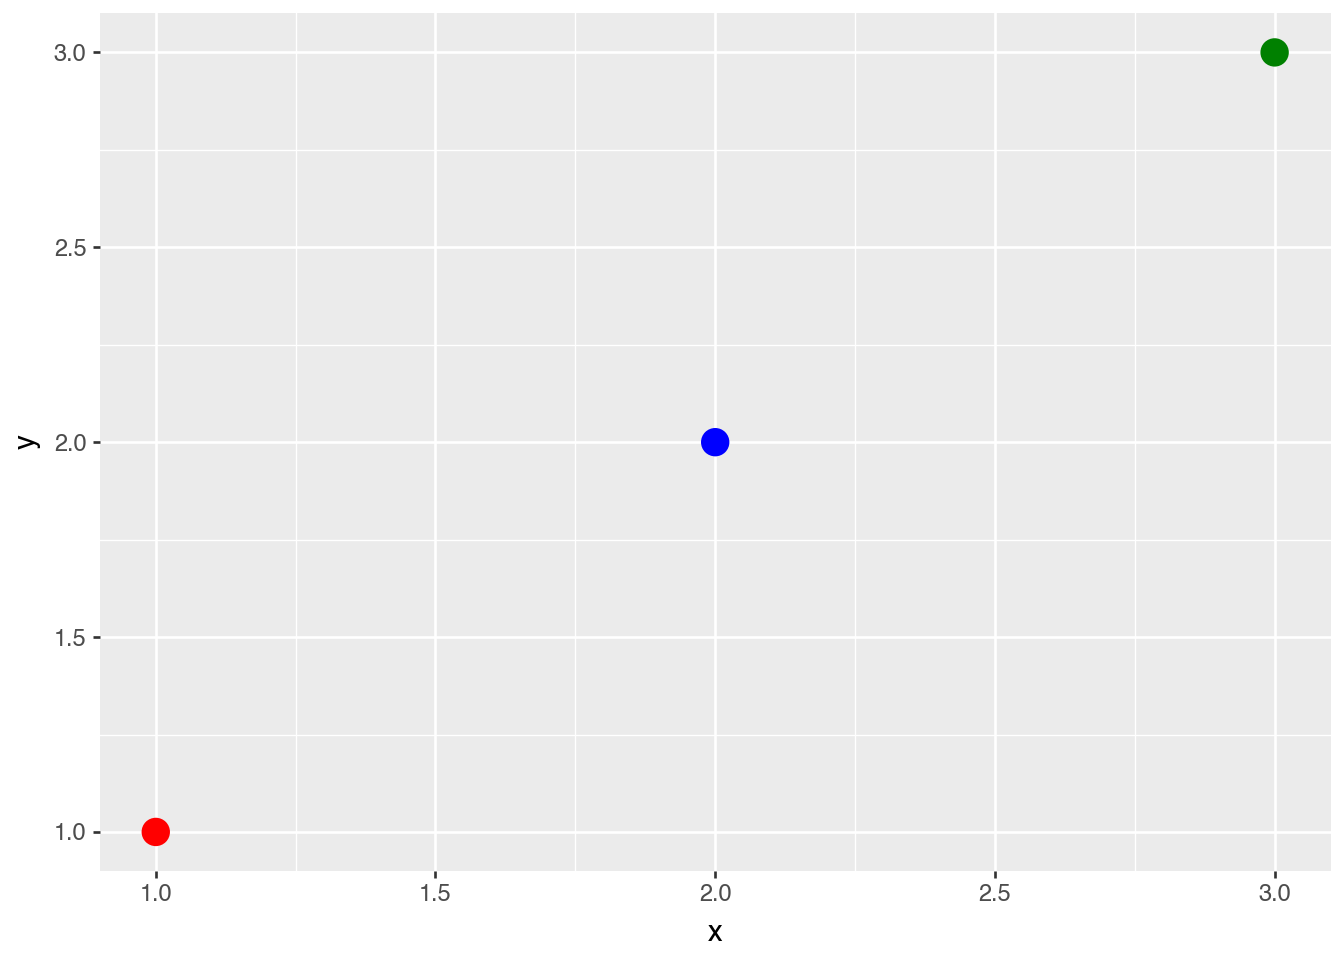
Identity Scales
df_identity = pl.DataFrame(
    {
        "x": [1, 2, 3],
        "y": [1, 2, 3],
        "my_color": ["red", "blue", "green"],
    }
)

(
    ggplot(df_identity)
    .aes("x", "y", color="my_color")
    .geom_point(size=5)
    .scale_color_identity()
)
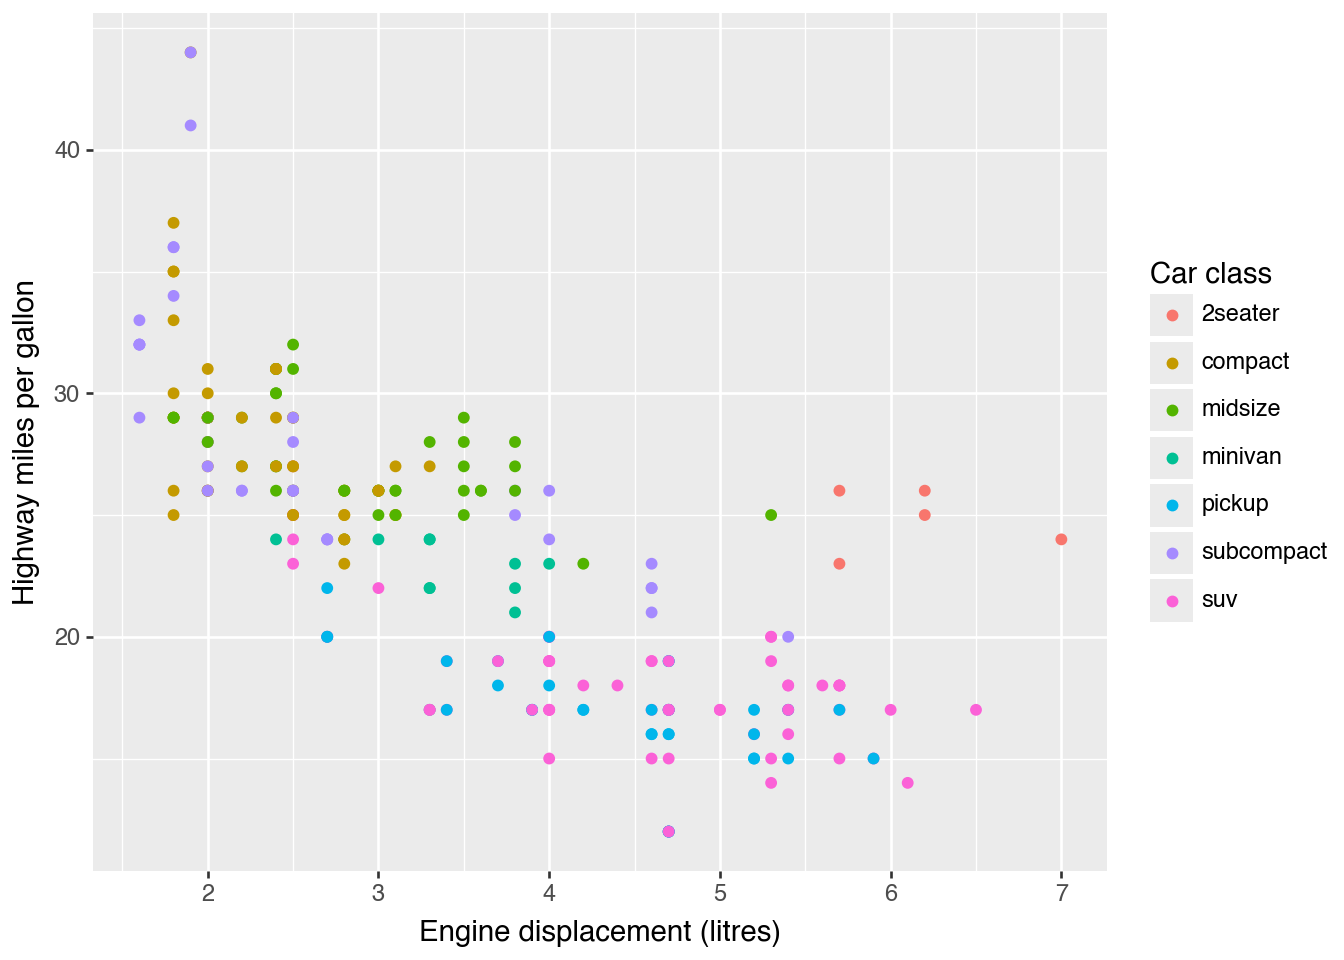
name= for Guide Labels
(
    ggplot(mpg)
    .aes("displ", "hwy", color="class")
    .geom_point()
    .scale_x_continuous(name="Engine displacement (litres)")
    .scale_y_continuous(name="Highway miles per gallon")
    .scale_color_discrete(name="Car class")
)
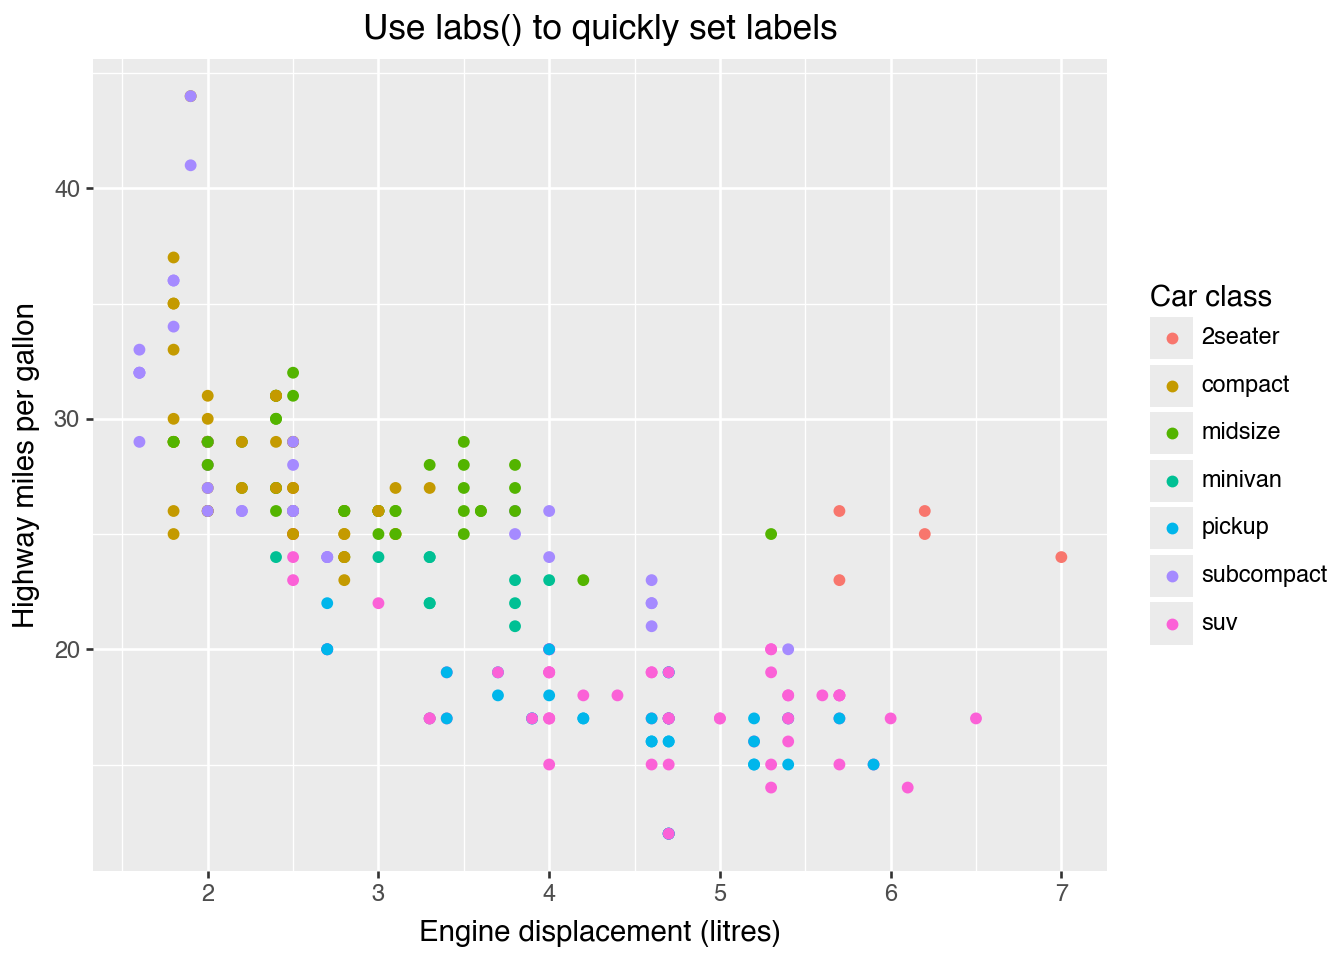
(
    ggplot(mpg)
    .aes("displ", "hwy", color="class")
    .geom_point()
    .xlab("Engine displacement (litres)")
    .labs(
        y="Highway miles per gallon",
        color="Car class",
        title="Use labs() to quickly set labels",
    )
)
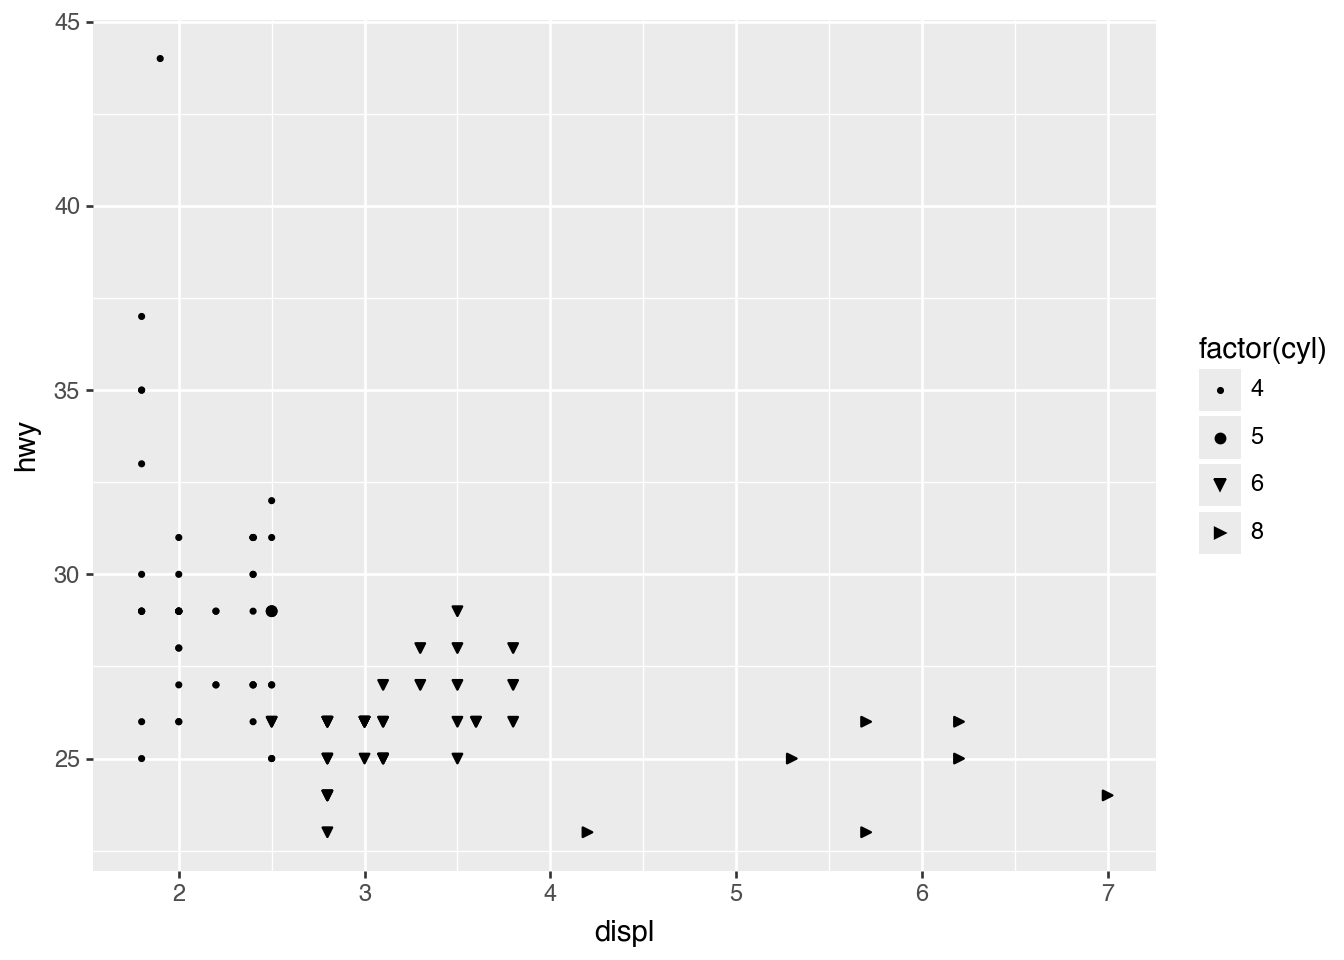
values= for Manual Styles
keep_classes = ["2seater", "compact", "midsize"]

(
    mpg
    .filter(pl.col("class").is_in(keep_classes))
    >>
    ggplot()
    .aes("displ", "hwy", shape="factor(cyl)")
    .geom_point()
    .scale_shape_manual(values=[".", "o", "v", ">"])
)
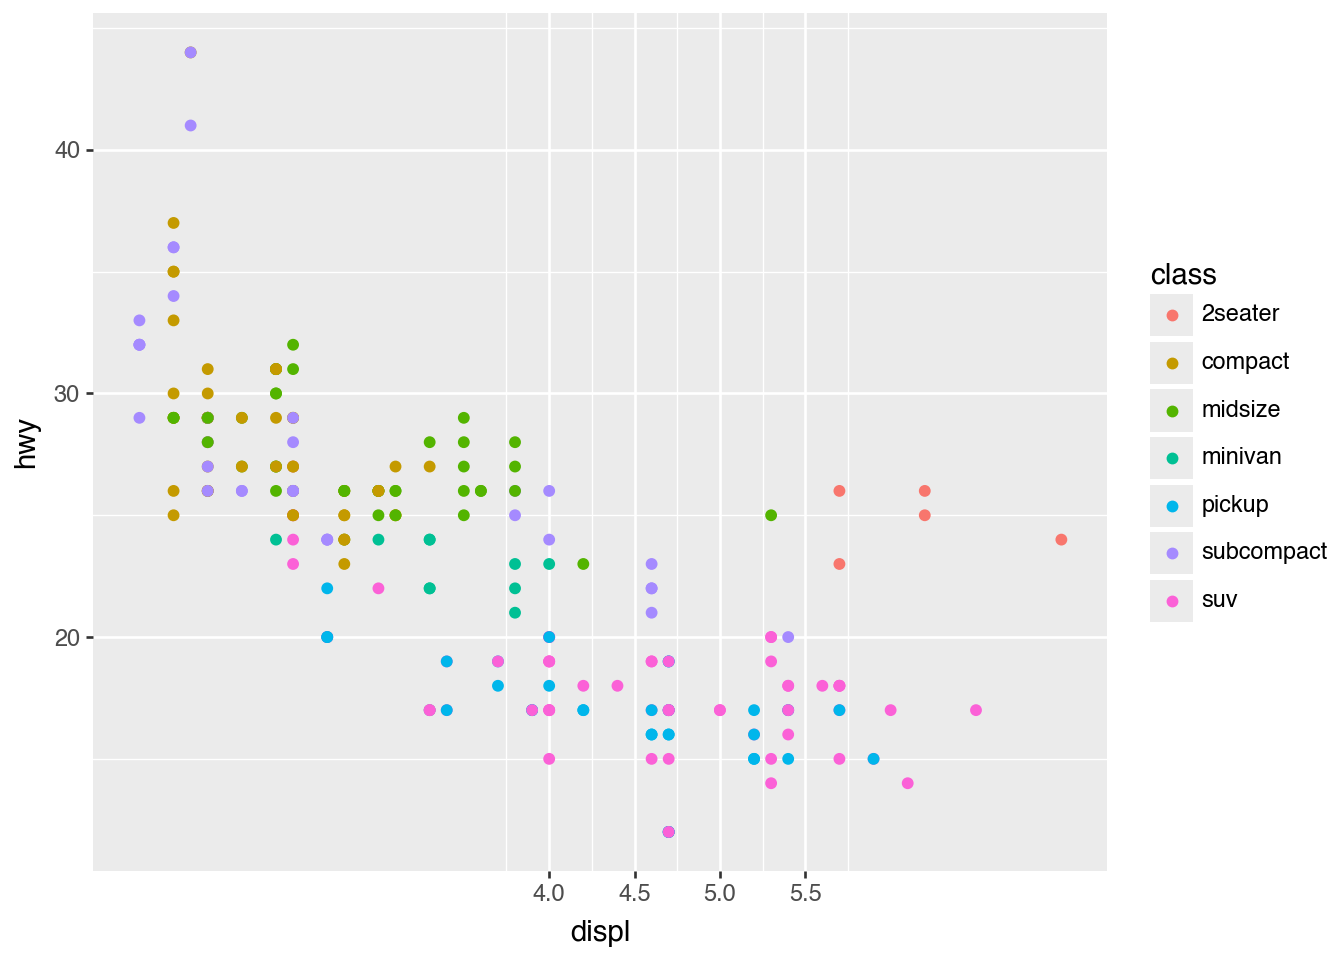
breaks= for Axis Ticks
(
    ggplot(mpg)
    .aes("displ", "hwy", color="class")
    .geom_point()
    .scale_x_continuous(breaks=[4, 4.5, 5, 5.5])
)
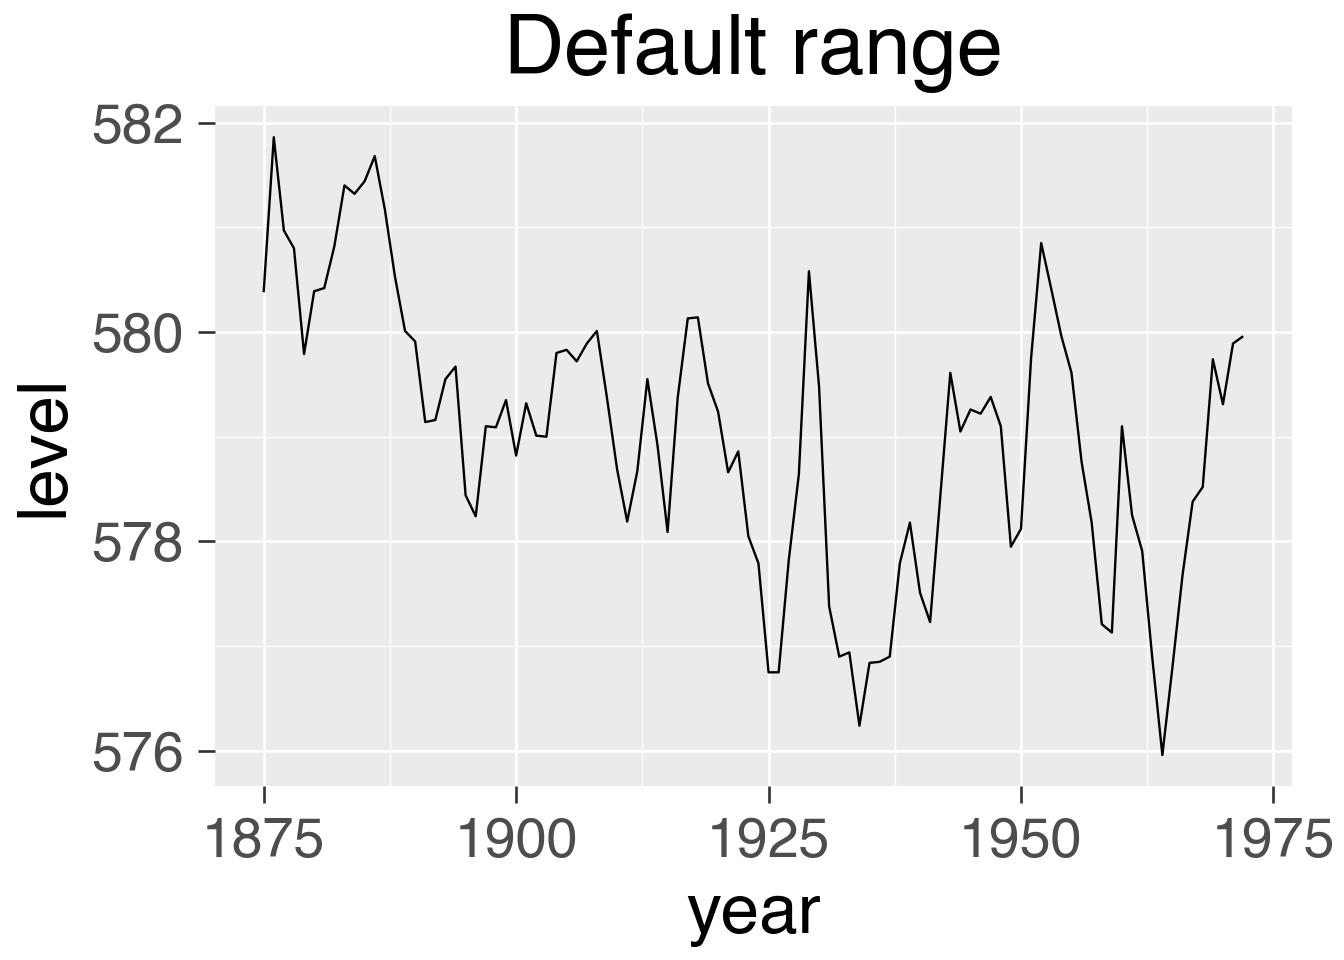
limits= for Restricting Range
huron_plot = (
    ggplot(huron)
    .aes("year", "level")
    .geom_line()
    .theme_grey(base_size=26)
)

(
    huron_plot
    .labs(title="Default range")
)
(
    huron_plot
    .scale_x_continuous(limits=[1950, 1960])
    .labs(title="Zoom in")
)
/Users/iangow/git/plotnine-fluid/.venv/lib/python3.14/site-packages/plotnine/geoms/geom_path.py:98: PlotnineWarning: geom_line: Removed 87 rows containing missing values.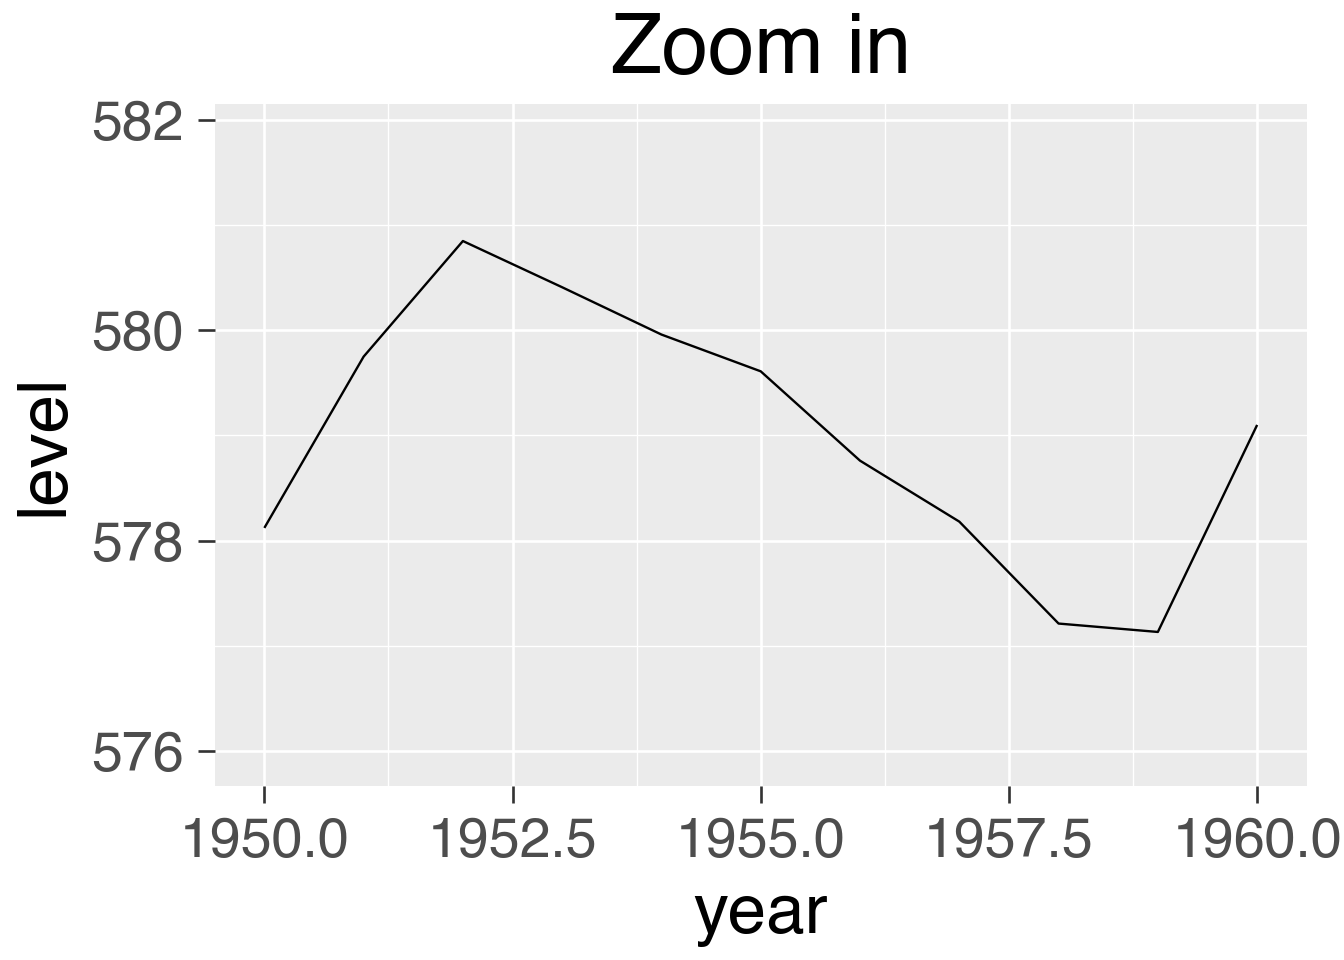
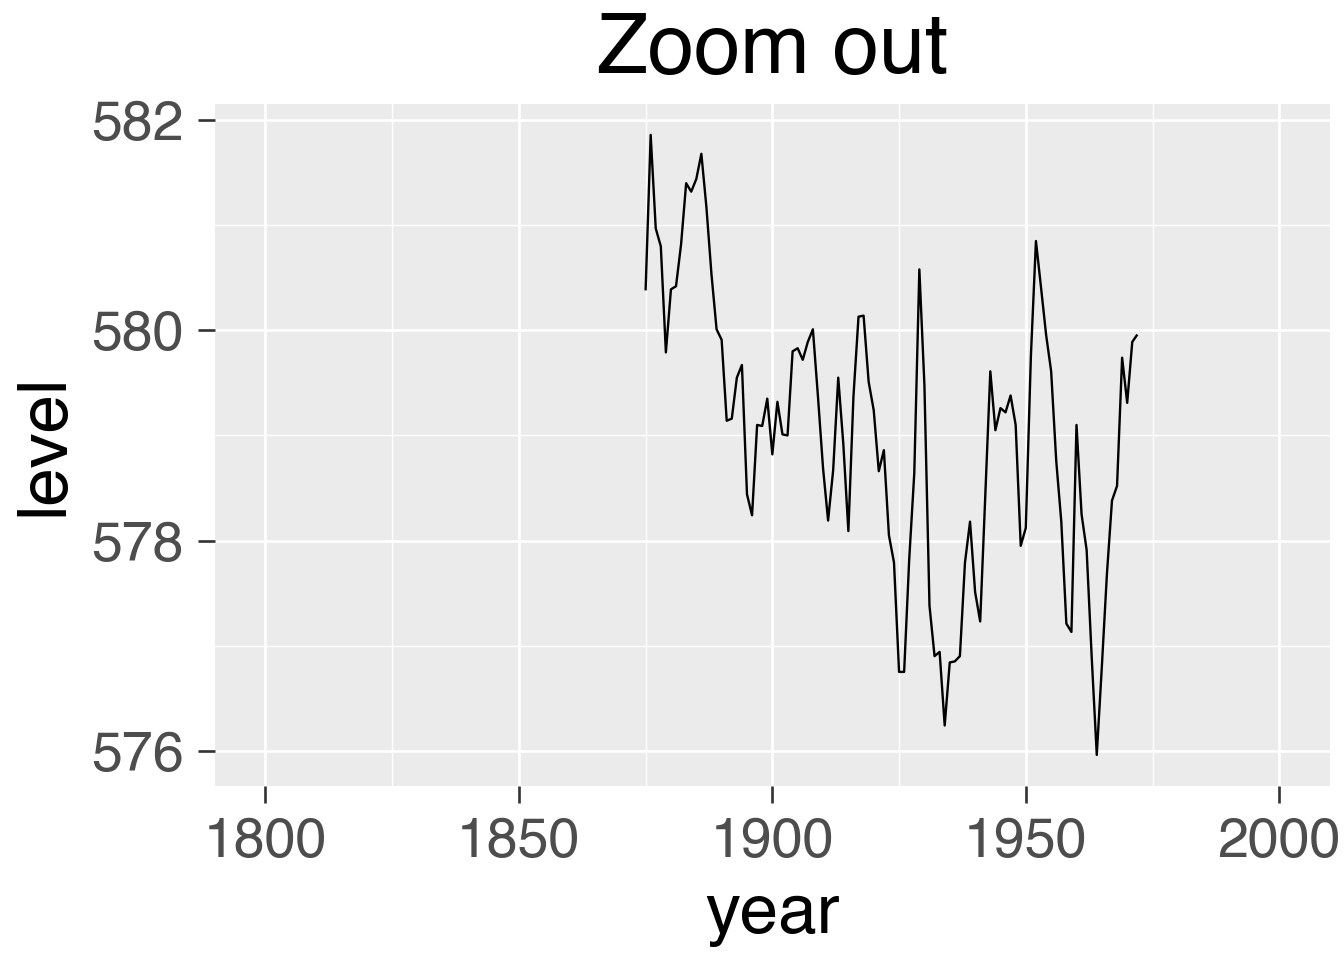
(
    huron_plot
    .scale_x_continuous(limits=[1800, 2000])
    .labs(title="Zoom out")
)
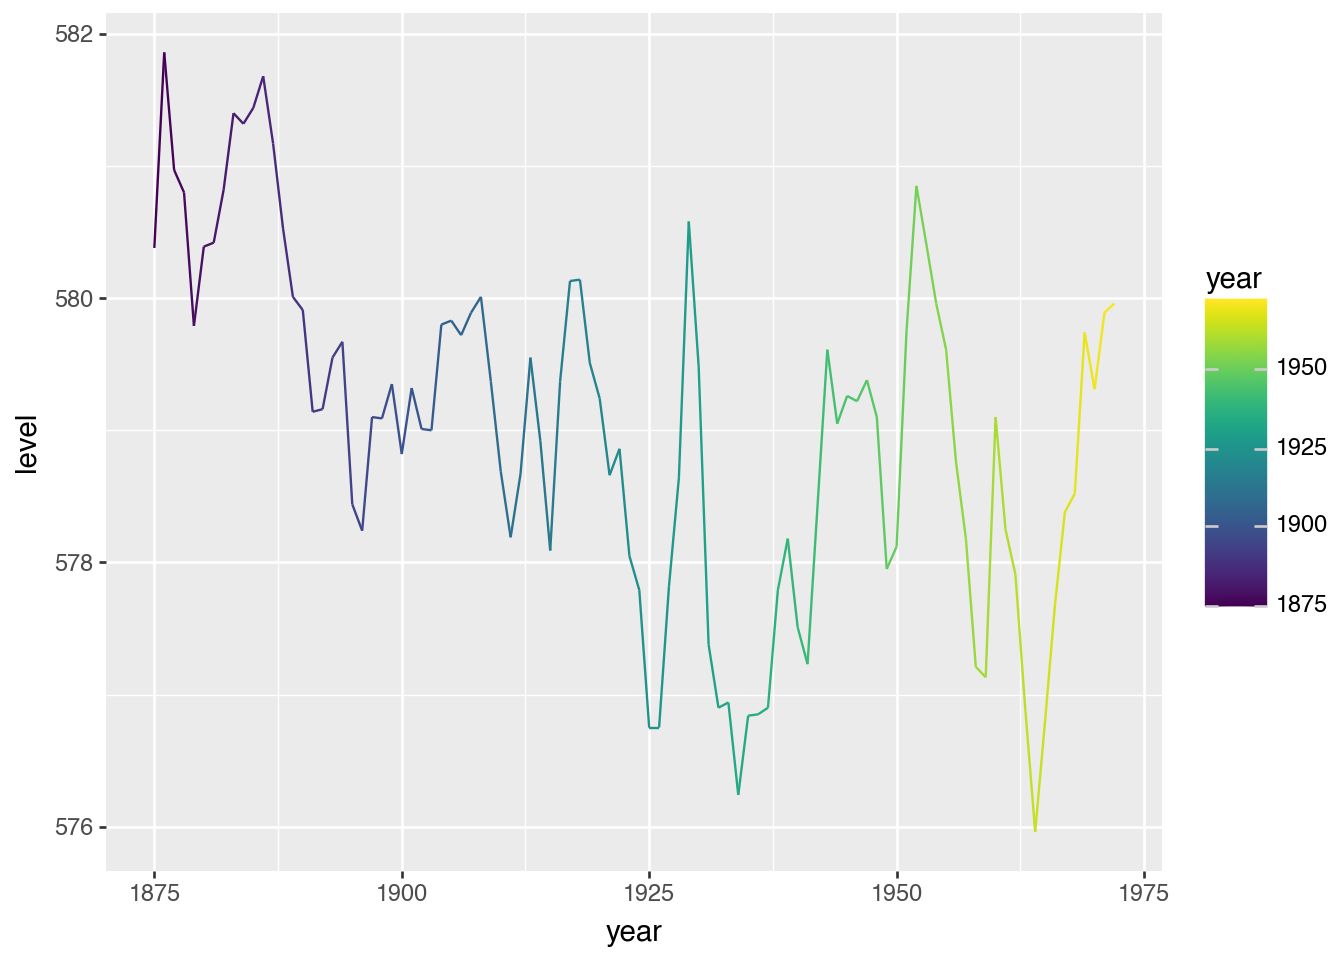
(
    ggplot(huron)
    .aes("year", "level", color="year")
    .geom_line()
)
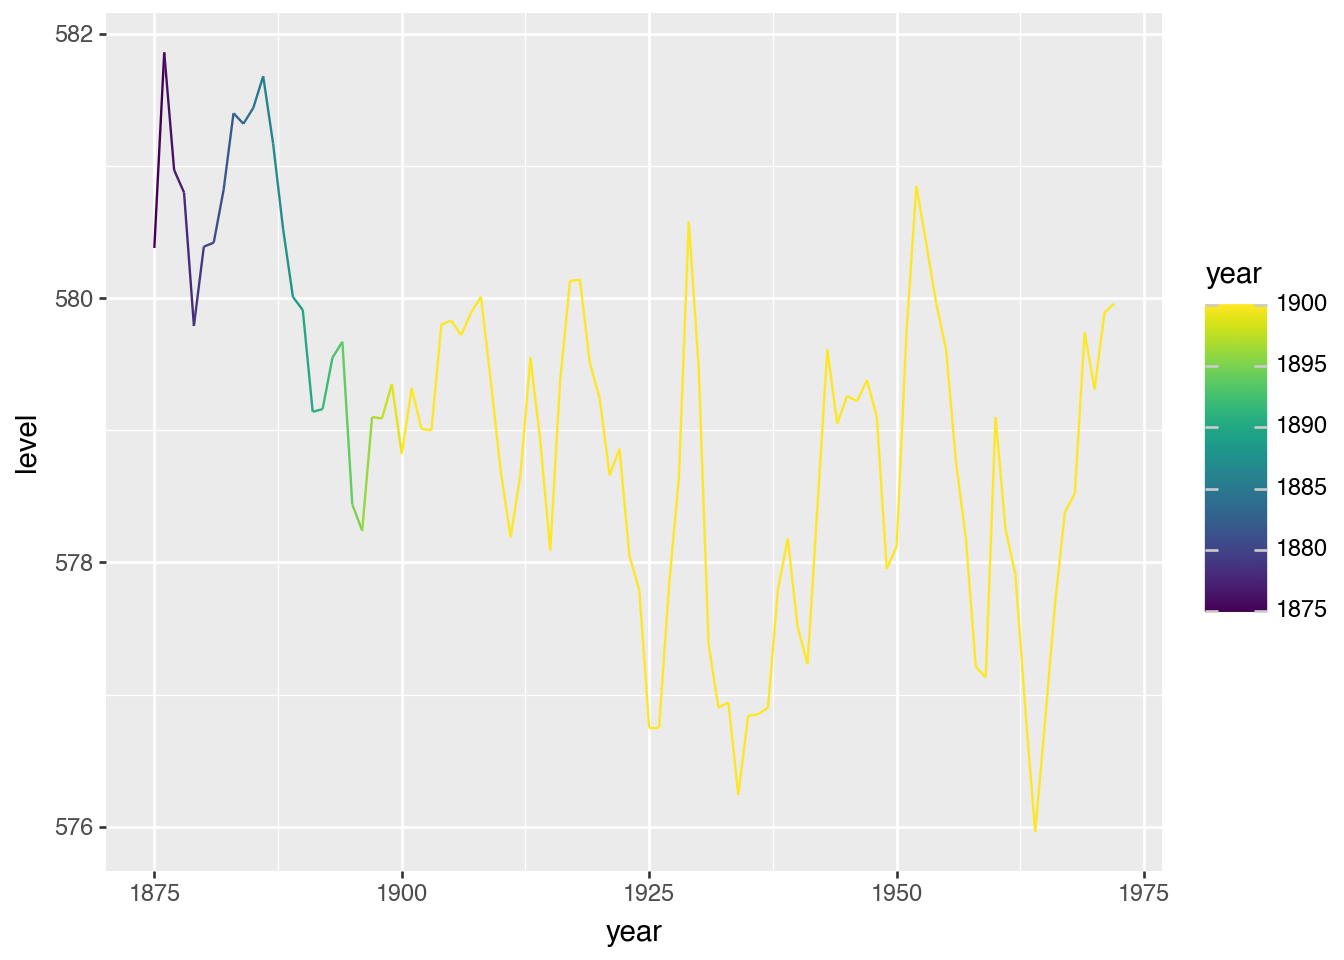
(
    ggplot(huron)
    .aes("year", "level", color="year")
    .geom_line()
    .scale_color_continuous(limits=[None, 1900])
)
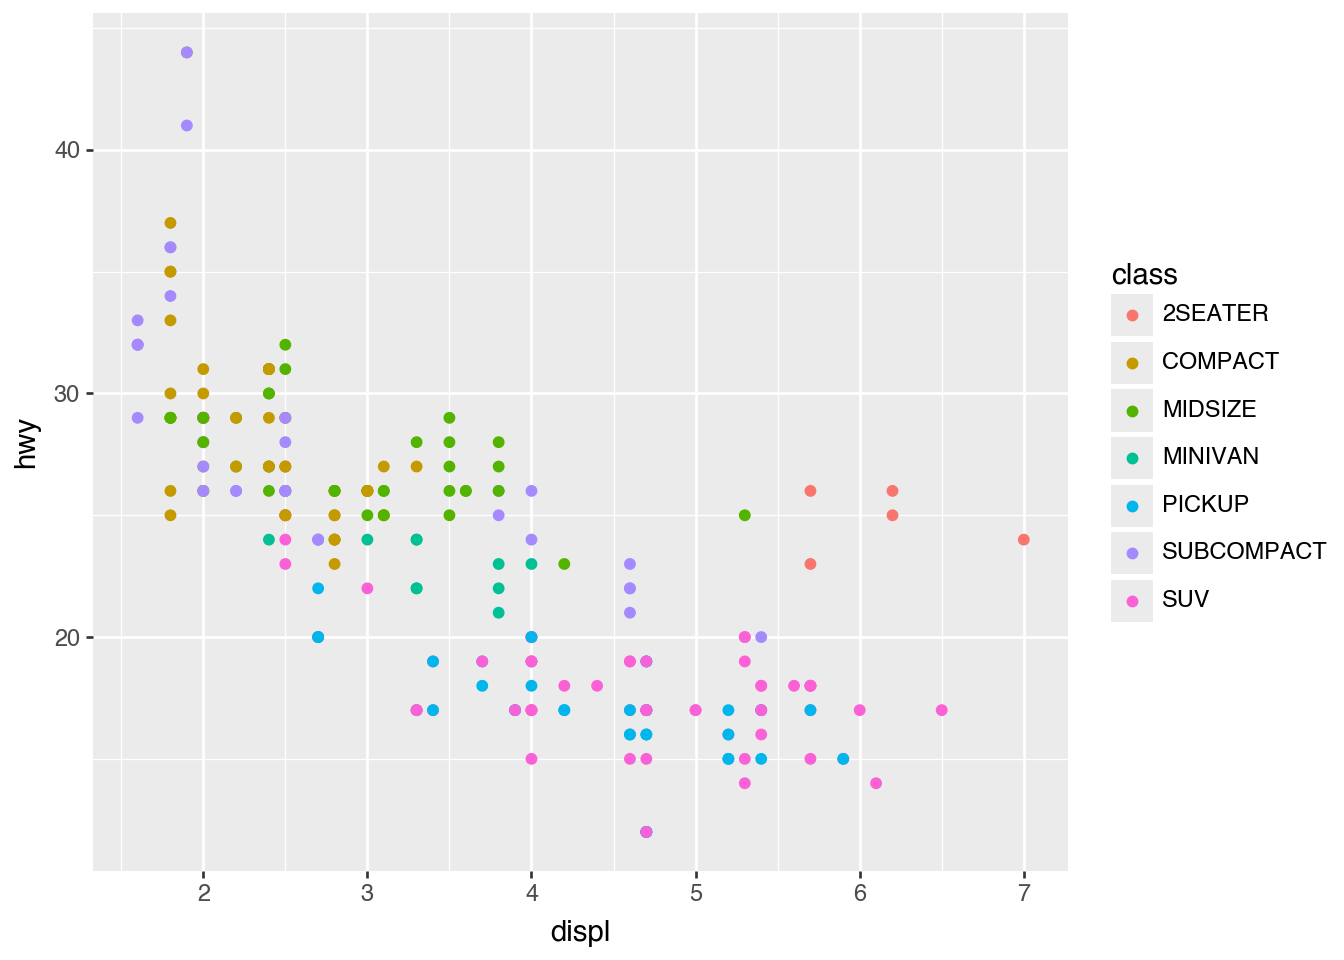
labels= for Break Labels
(
    ggplot(mpg)
    .aes("displ", "hwy", color="class")
    .geom_point()
    .scale_color_discrete(labels=lambda breaks: [s.upper() for s in breaks])
)
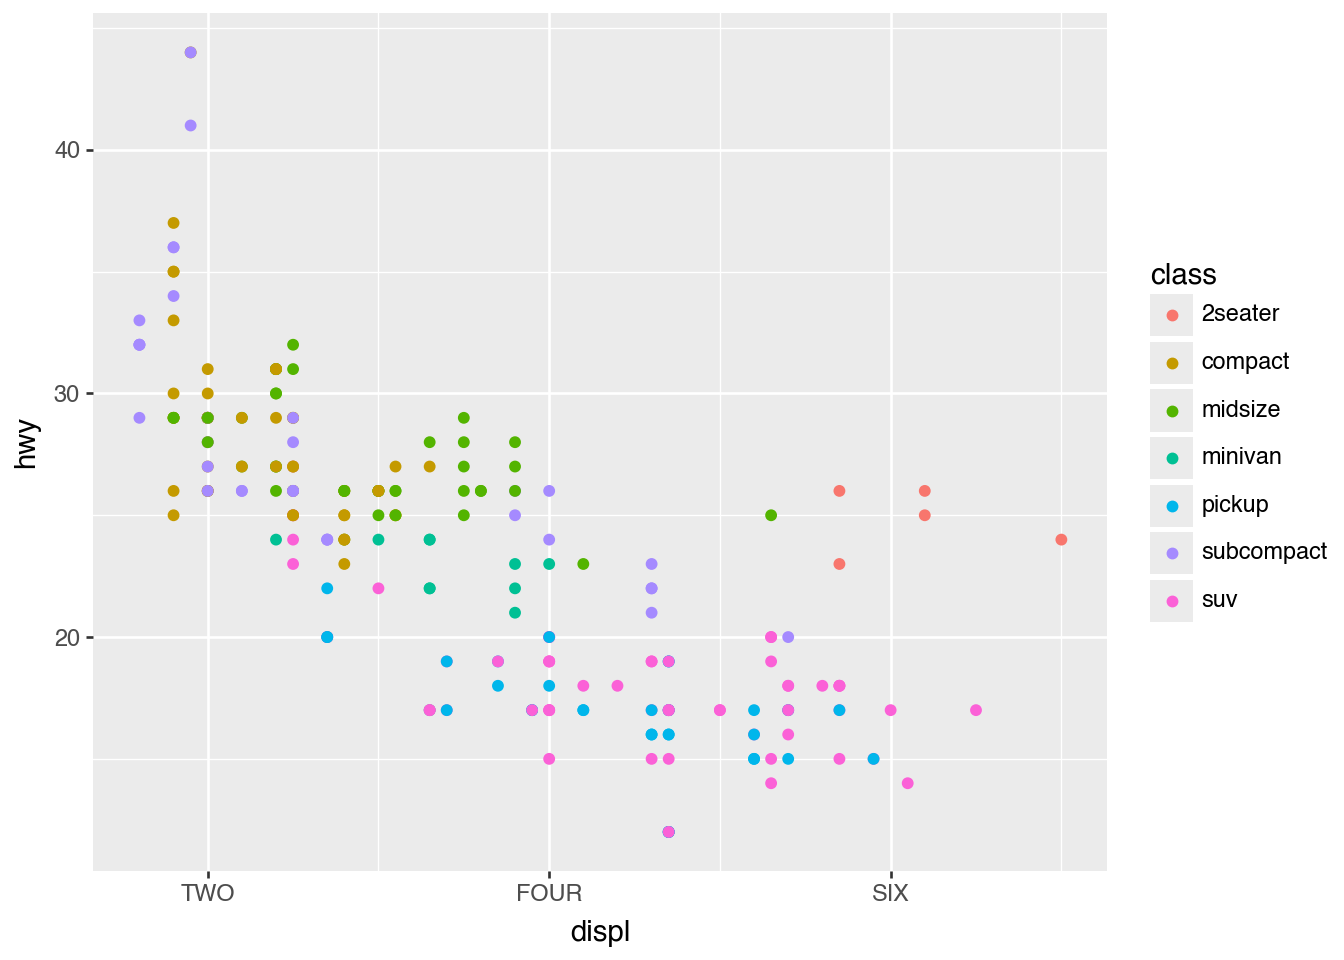
(
    ggplot(mpg)
    .aes("displ", "hwy", color="class")
    .geom_point()
    .scale_x_continuous(breaks=[2, 4, 6], labels=["TWO", "FOUR", "SIX"])
)
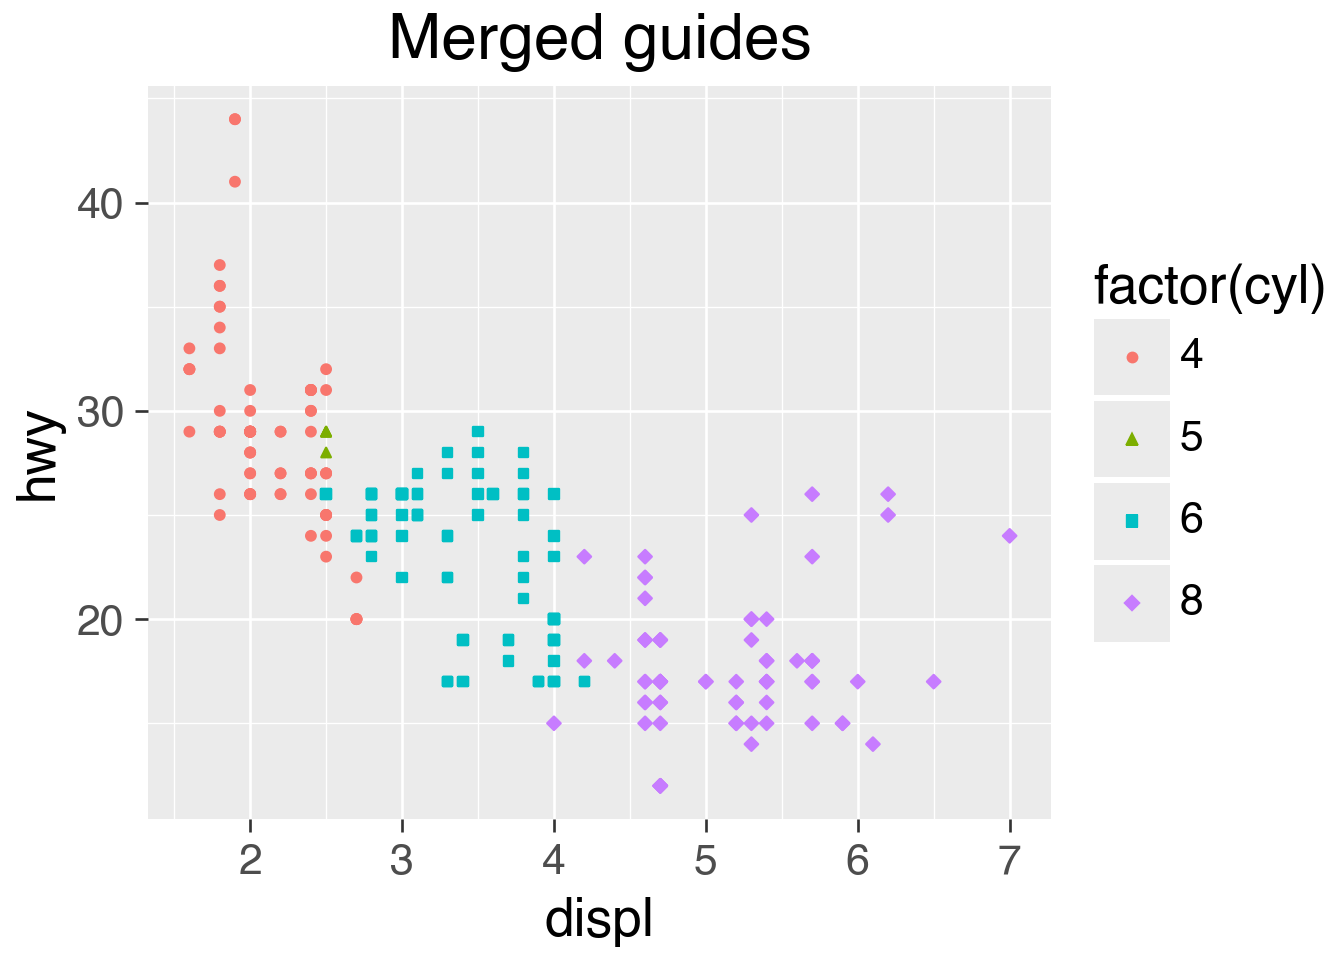
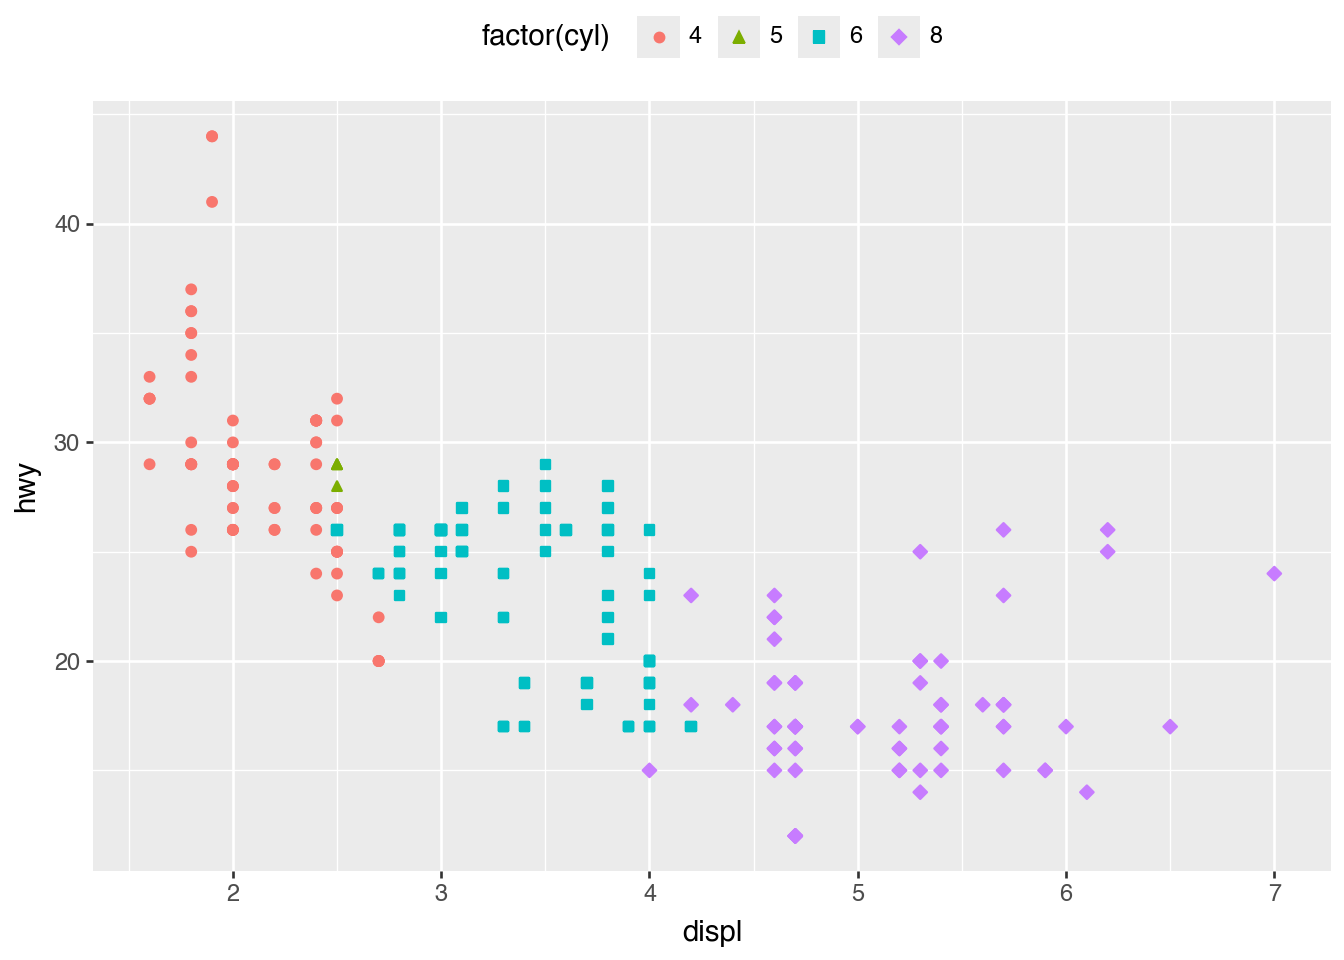
Legend Merging
merged_legend_plot = (
    ggplot(mpg)
    .aes("displ", "hwy", color="factor(cyl)", shape="factor(cyl)")
    .geom_point()
    .theme_grey(base_size=20)
)

(
    merged_legend_plot
    .labs(title="Merged guides")
)
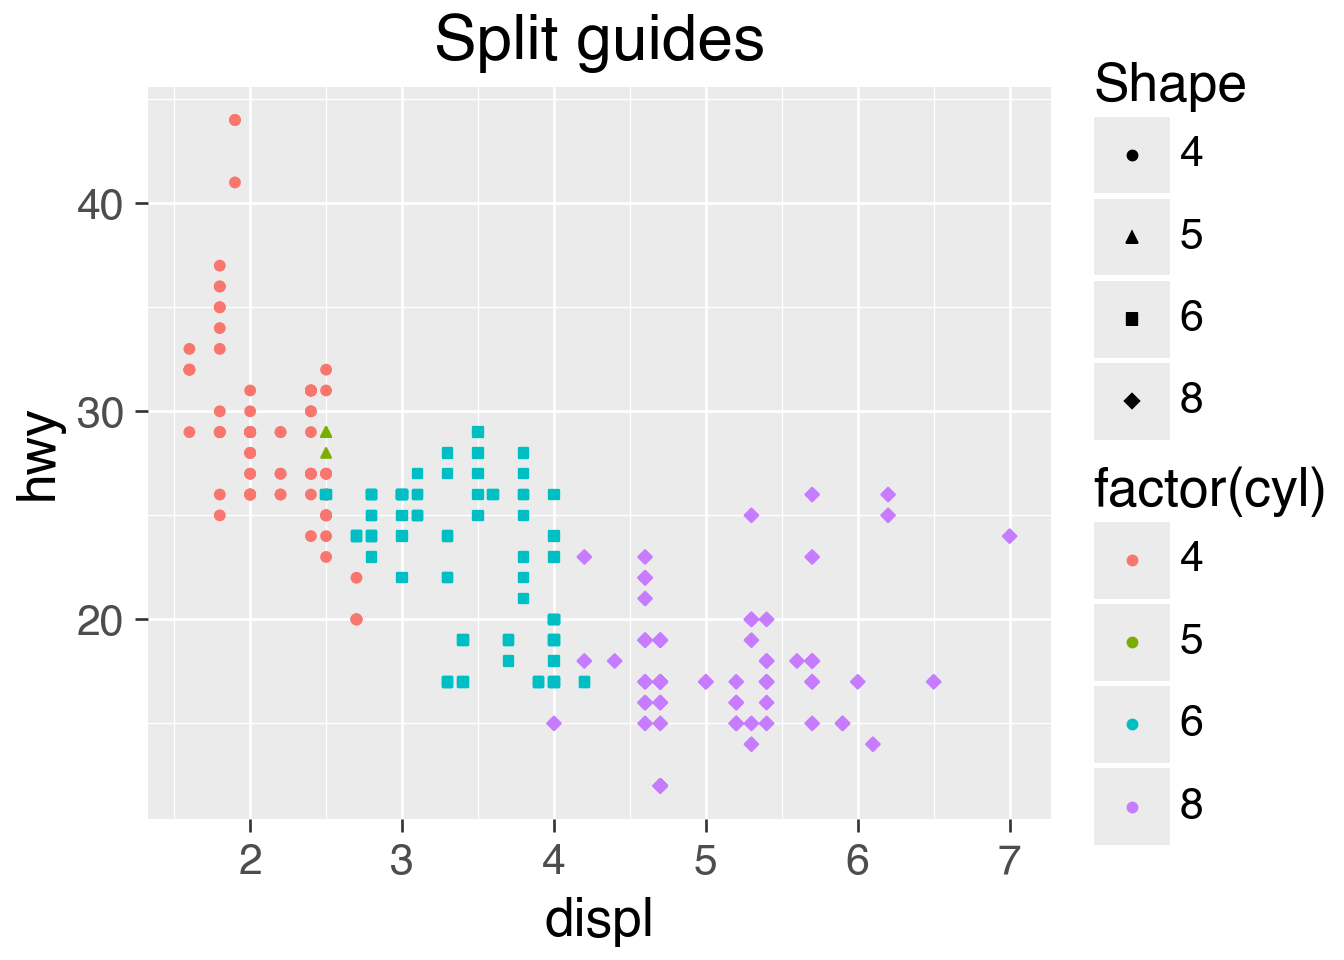
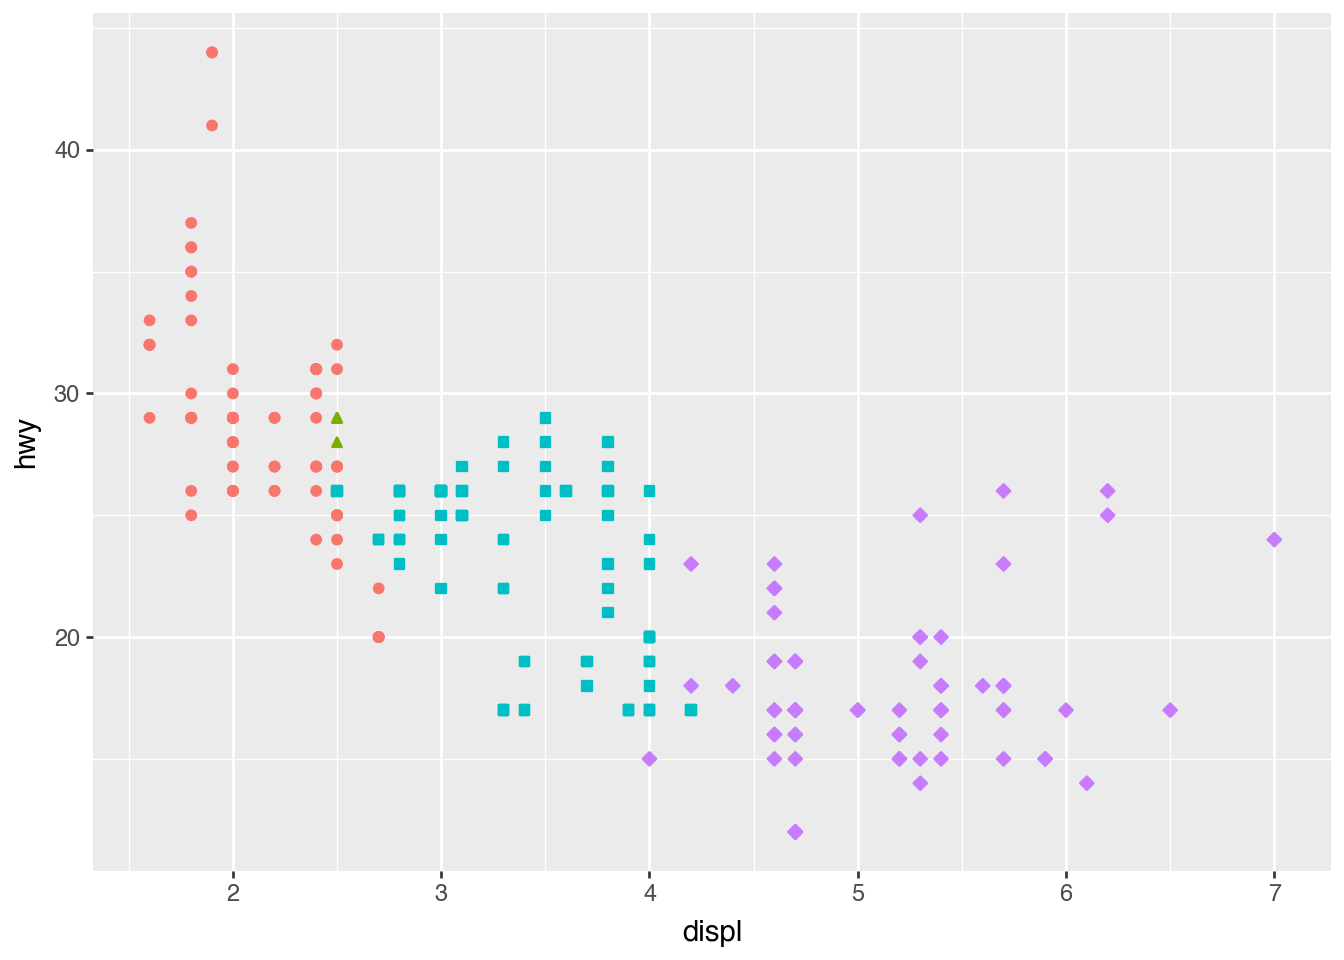
(
    merged_legend_plot
    .labs(title="Split guides")
    .scale_shape_discrete(name="Shape")
)
Legend Position
legend_position_plot = (
    ggplot(mpg)
    .aes("displ", "hwy", color="factor(cyl)", shape="factor(cyl)")
    .geom_point()
)

(
    legend_position_plot
    .add_theme(legend_position="top")
)
(
    legend_position_plot
    .add_theme(legend_position="none")
)
Guide Customization
guide_plot = (
    ggplot(mpg)
    .aes("displ", "hwy", color="cyl")
    .geom_point()
    .add_theme(legend_key_size=30)
)

guide_plot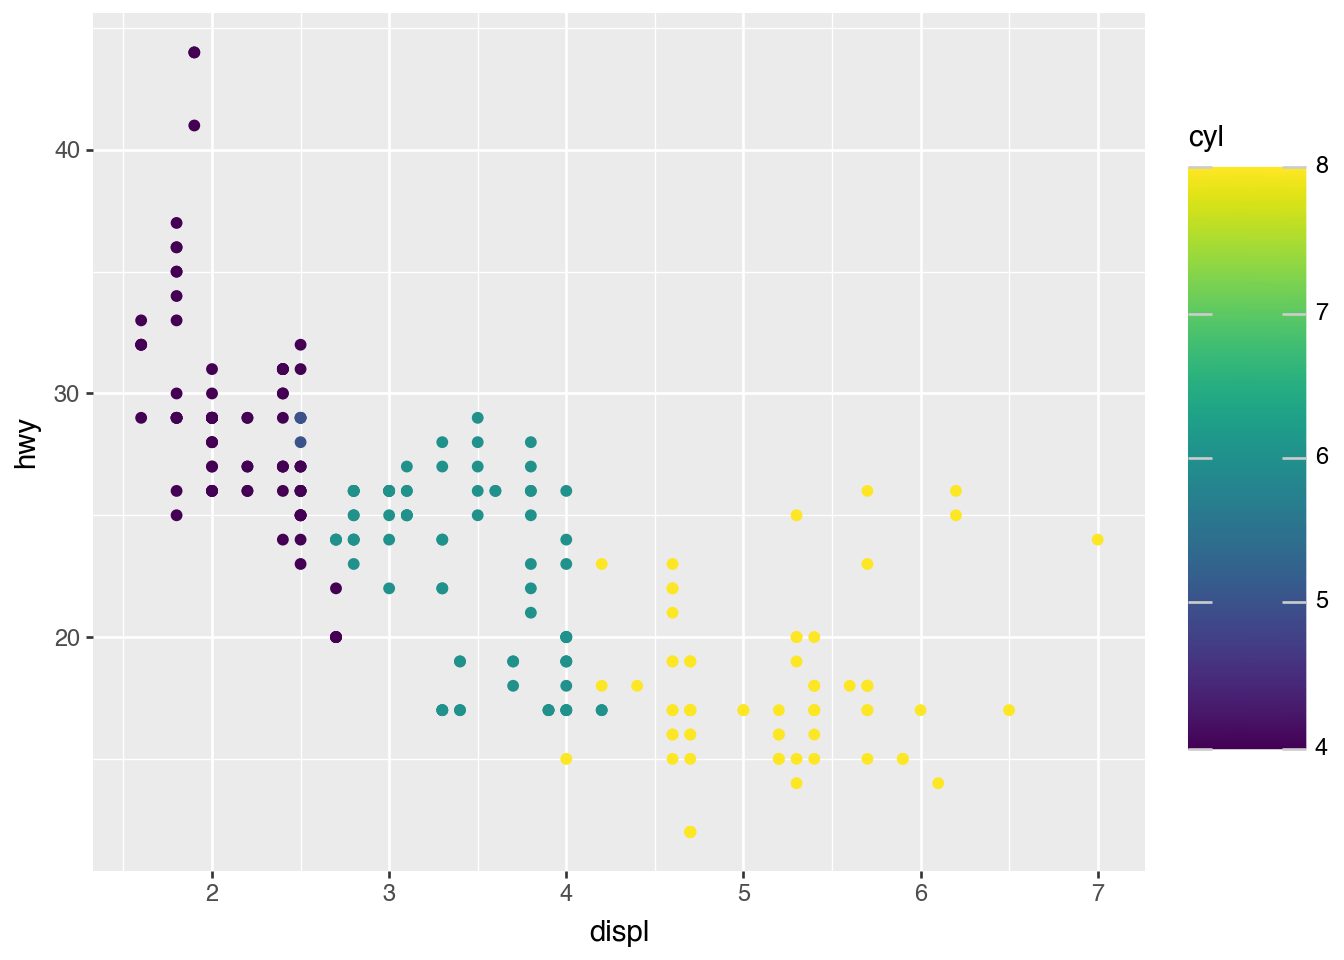
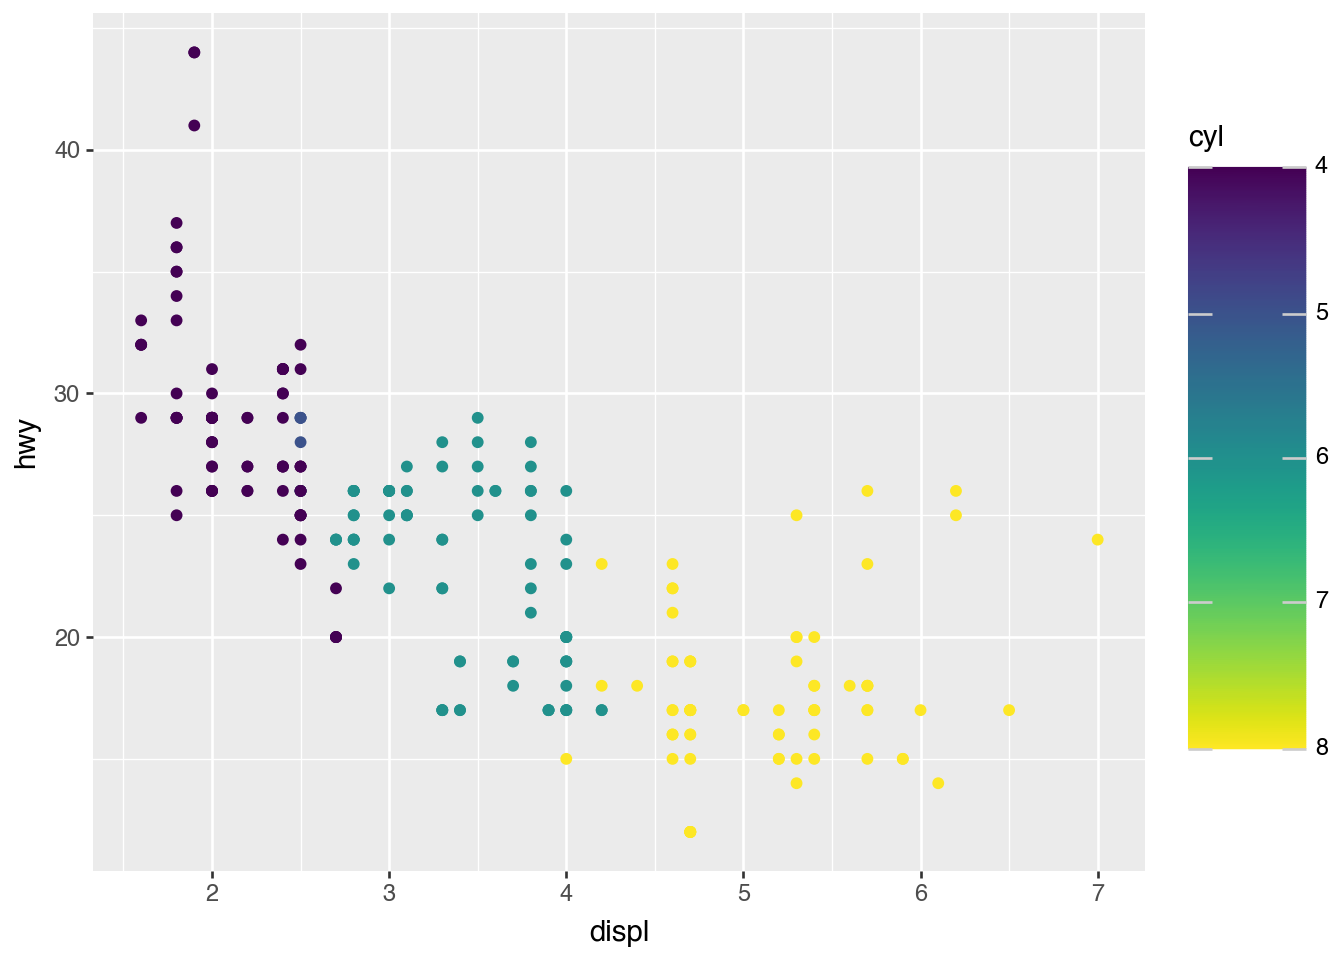
(
    guide_plot
    .add_guides(color=p9.guide_colorbar(reverse=True))
)
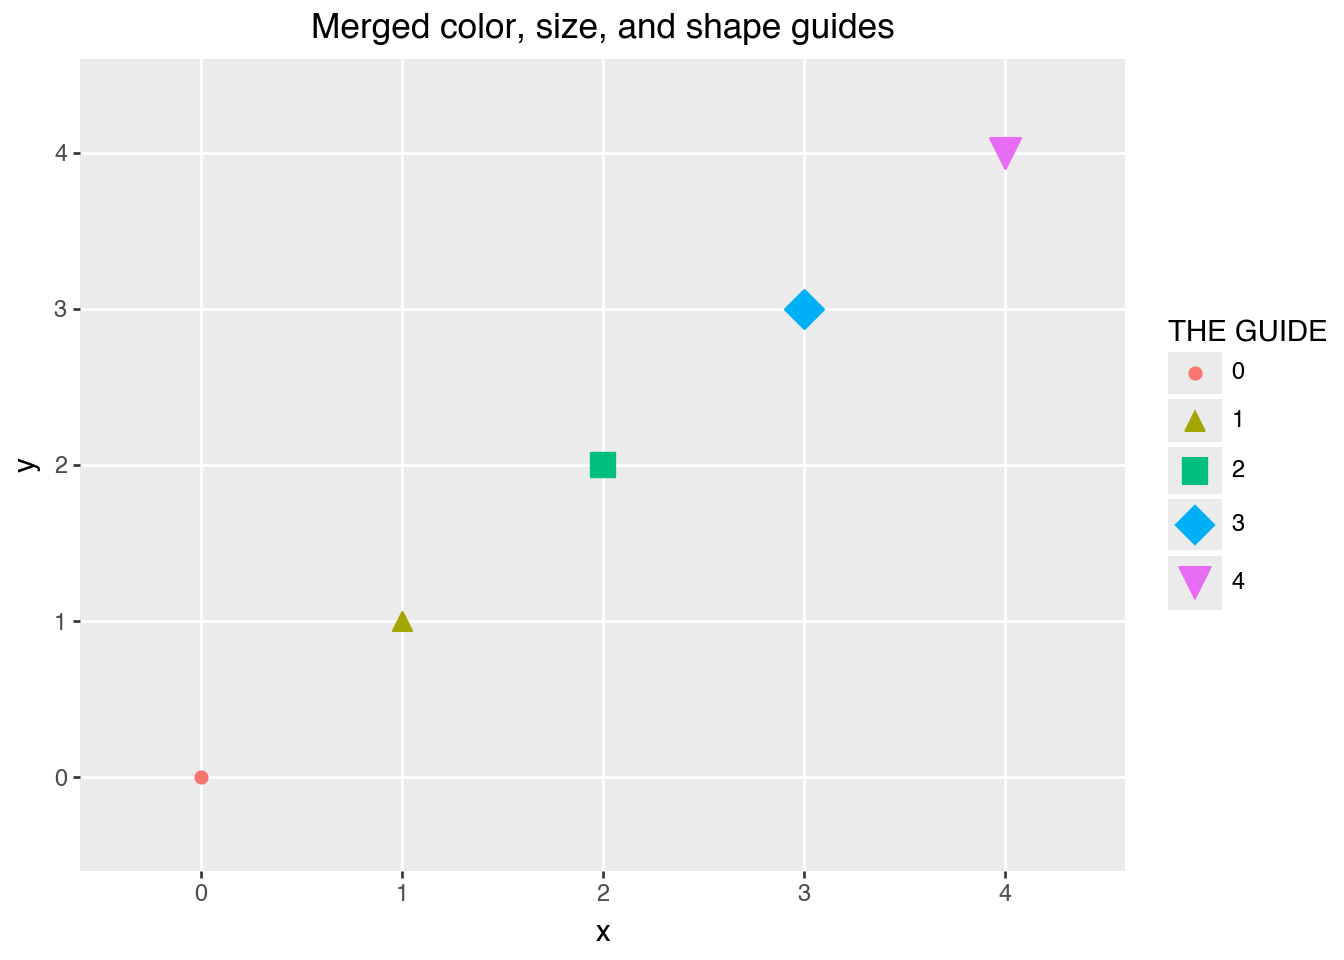
(
    pl.DataFrame(
        {
            "x": list(map(str, range(5))),
            "y": list(map(str, range(5))),
            "p": list(map(str, range(5))),
            "q": list(map(str, range(5))),
            "r": list(map(str, range(5))),
        }
    )
    >>
    ggplot()
    .aes("x", "y", color="p", size="q", shape="r")
    .geom_point()
    .labs(title="Merged color, size, and shape guides")
    .add_guides(
        color=p9.guide_legend("THE GUIDE"),
        size=p9.guide_legend("THE GUIDE"),
        shape=p9.guide_legend("THE GUIDE"),
    )
)
/Users/iangow/git/plotnine-fluid/.venv/lib/python3.14/site-packages/plotnine/scales/scale_size.py:46: PlotnineWarning: Using size for a discrete variable is not advised.