import polars as pl
import plotnine as p9
import plotnine_polars
from plotnine import aes
from plotnine_polars import ggplot
from plotnine.data import huron, mpgScales, Legends, and Guides
This notebook adapts the plotnine guide on scales, legends, and guides to the plotnine_polars style. Where the original page uses pandas for small example tables, this version uses Polars.
Setup
mpg = pl.from_pandas(mpg)
huron = pl.from_pandas(huron)

mpg.head()
shape: (5, 11)
| manufacturer | model | displ | year | cyl | trans | drv | cty | hwy | fl | class |
|---|---|---|---|---|---|---|---|---|---|---|
| str | str | f64 | i64 | i64 | str | str | i64 | i64 | str | str |
| "audi" | "a4" | 1.8 | 1999 | 4 | "auto(l5)" | "f" | 18 | 29 | "p" | "compact" |
| "audi" | "a4" | 1.8 | 1999 | 4 | "manual(m5)" | "f" | 21 | 29 | "p" | "compact" |
| "audi" | "a4" | 2.0 | 2008 | 4 | "manual(m6)" | "f" | 20 | 31 | "p" | "compact" |
| "audi" | "a4" | 2.0 | 2008 | 4 | "auto(av)" | "f" | 21 | 30 | "p" | "compact" |
| "audi" | "a4" | 2.8 | 1999 | 6 | "auto(l5)" | "f" | 16 | 26 | "p" | "compact" |
Scale Basics
Manual Color Mapping
(
    mpg.ggplot()
    .aes("displ", "hwy", color="class")
    .geom_point()
    .scale_color_manual(
        name="Car class",
        breaks=["2seater", "compact"],
        values=["red", "blue"],
    )
)
/Users/igow/git/plotnine/plotnine/scales/scale_manual.py:45: PlotnineWarning: The palette of scale_color_manual can return a maximum of 2 values. 7 were requested from it.
/Users/igow/git/plotnine/plotnine/scales/scale_manual.py:45: PlotnineWarning: The palette of scale_color_manual can return a maximum of 2 values. 7 were requested from it.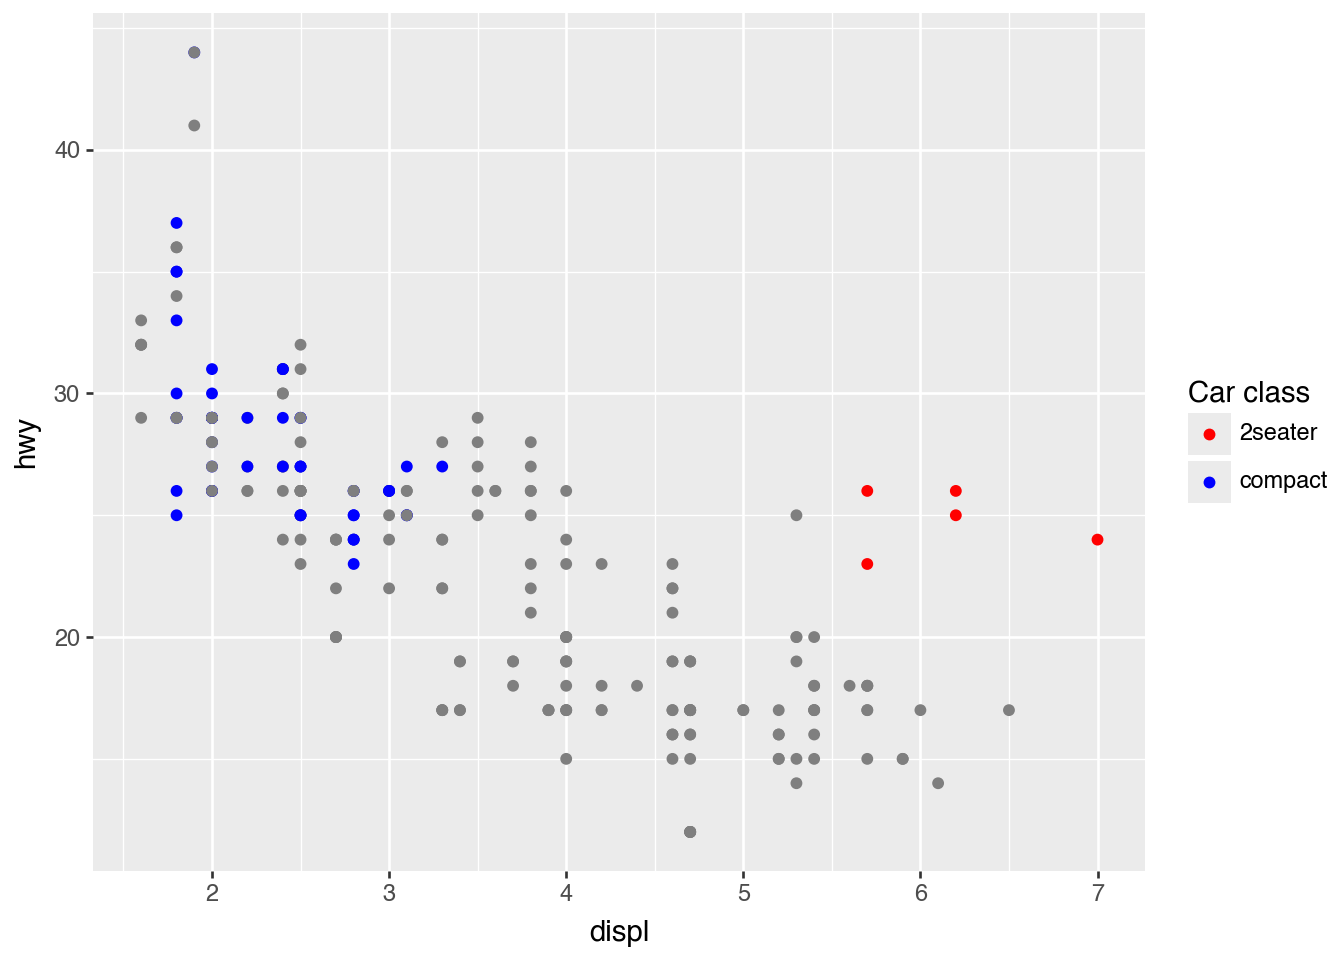
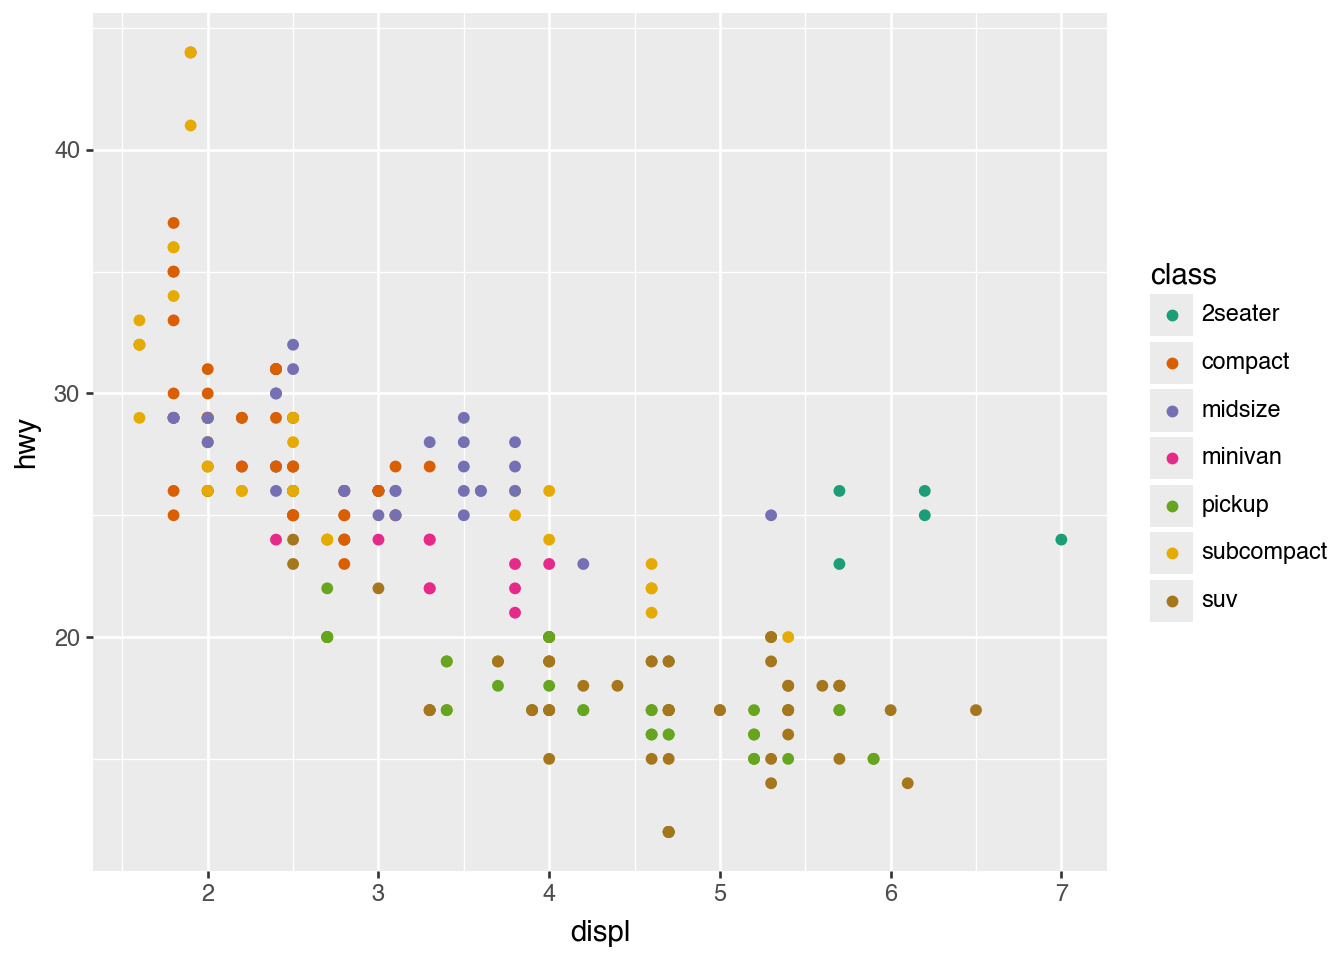
ColorBrewer Palette
(
    mpg.ggplot()
    .aes("displ", "hwy", color="class")
    .geom_point()
    .scale_color_brewer(type="qual", palette=2)
)
Varieties of Scales
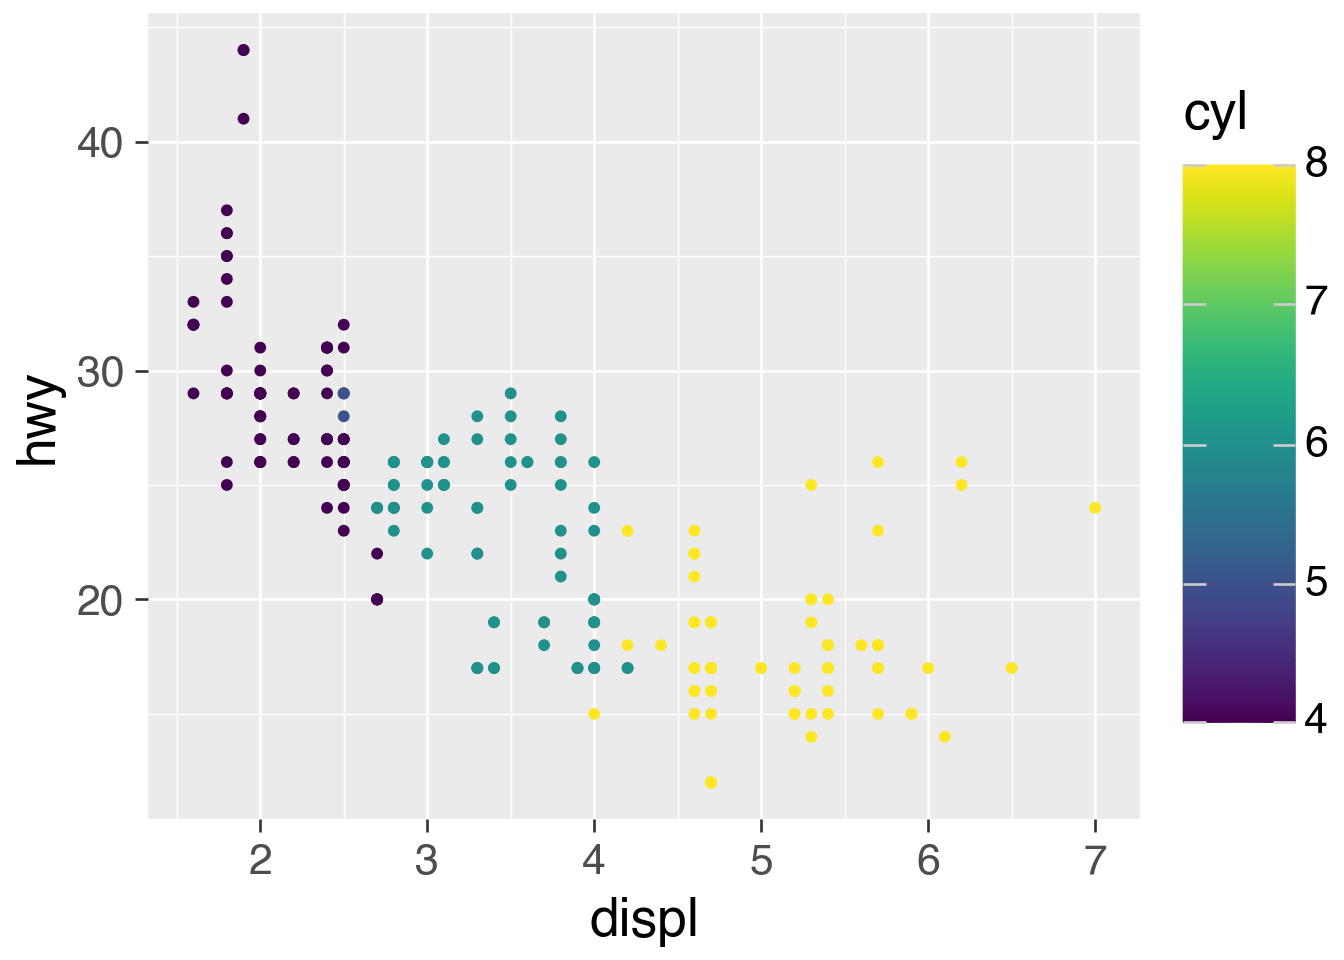
Default Continuous and Discrete Color Scales
base_plot = mpg.ggplot().aes("displ", "hwy").theme_grey(base_size=20)

(
    base_plot
    .geom_point(aes(color="cyl"))
)
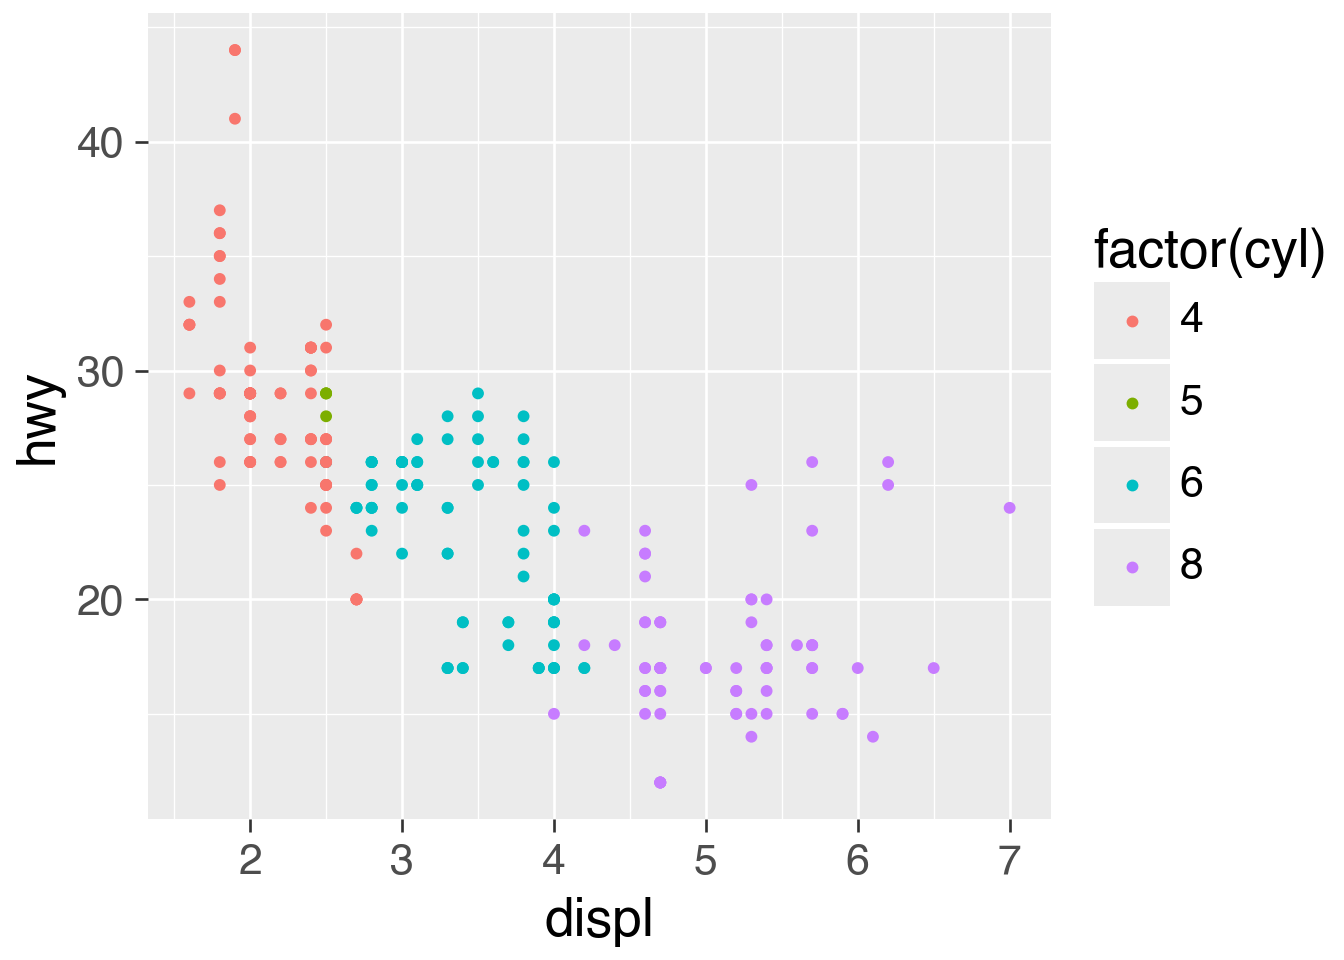
(
    base_plot
    .geom_point(aes(color="factor(cyl)"))
)
Position Scales
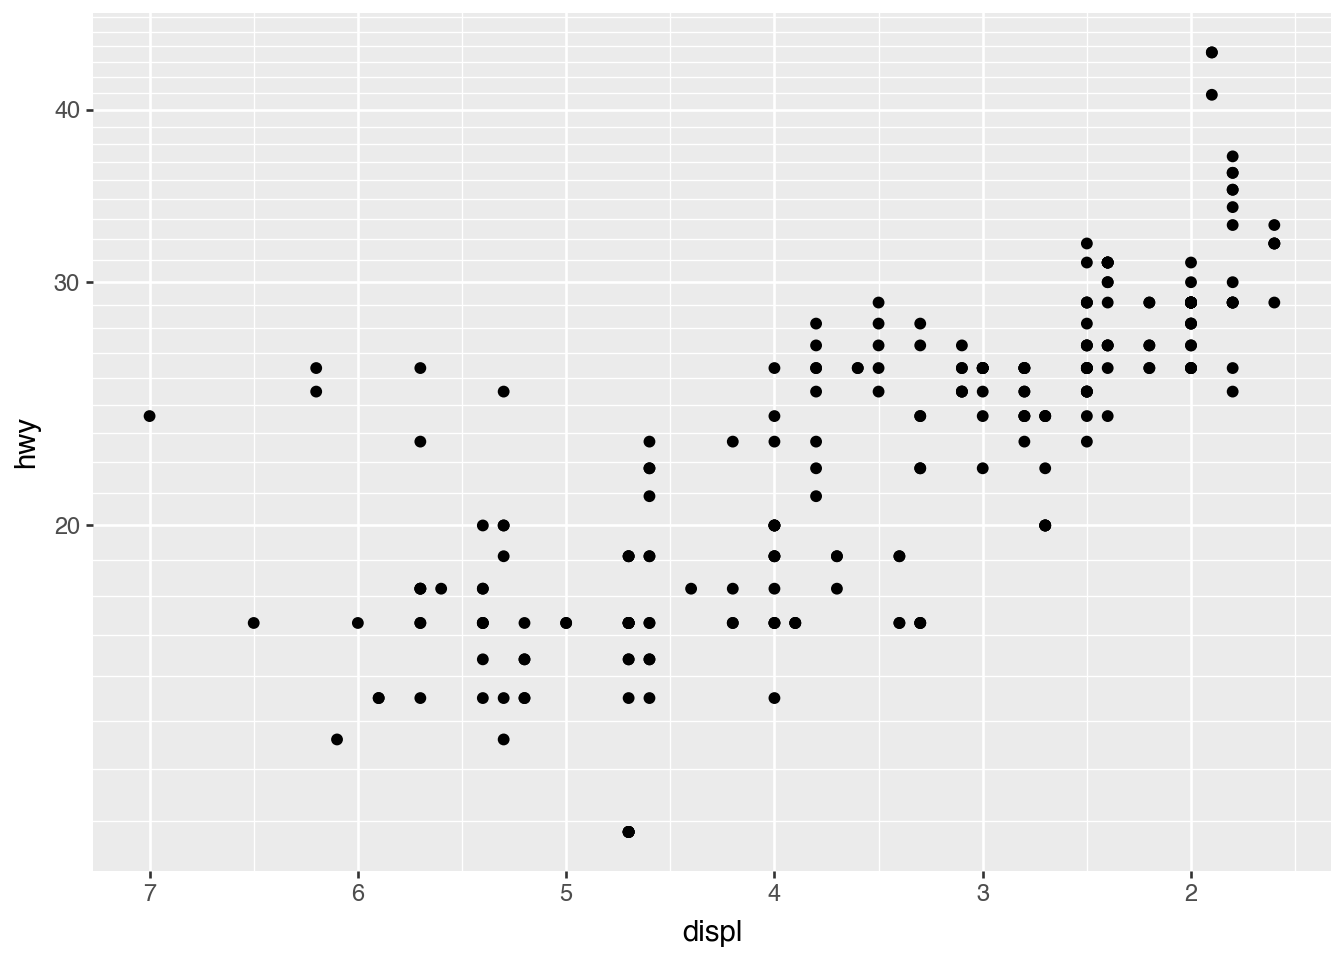
(
    mpg.ggplot()
    .aes("displ", "hwy")
    .geom_point()
    .scale_x_reverse()
    .scale_y_log10()
)
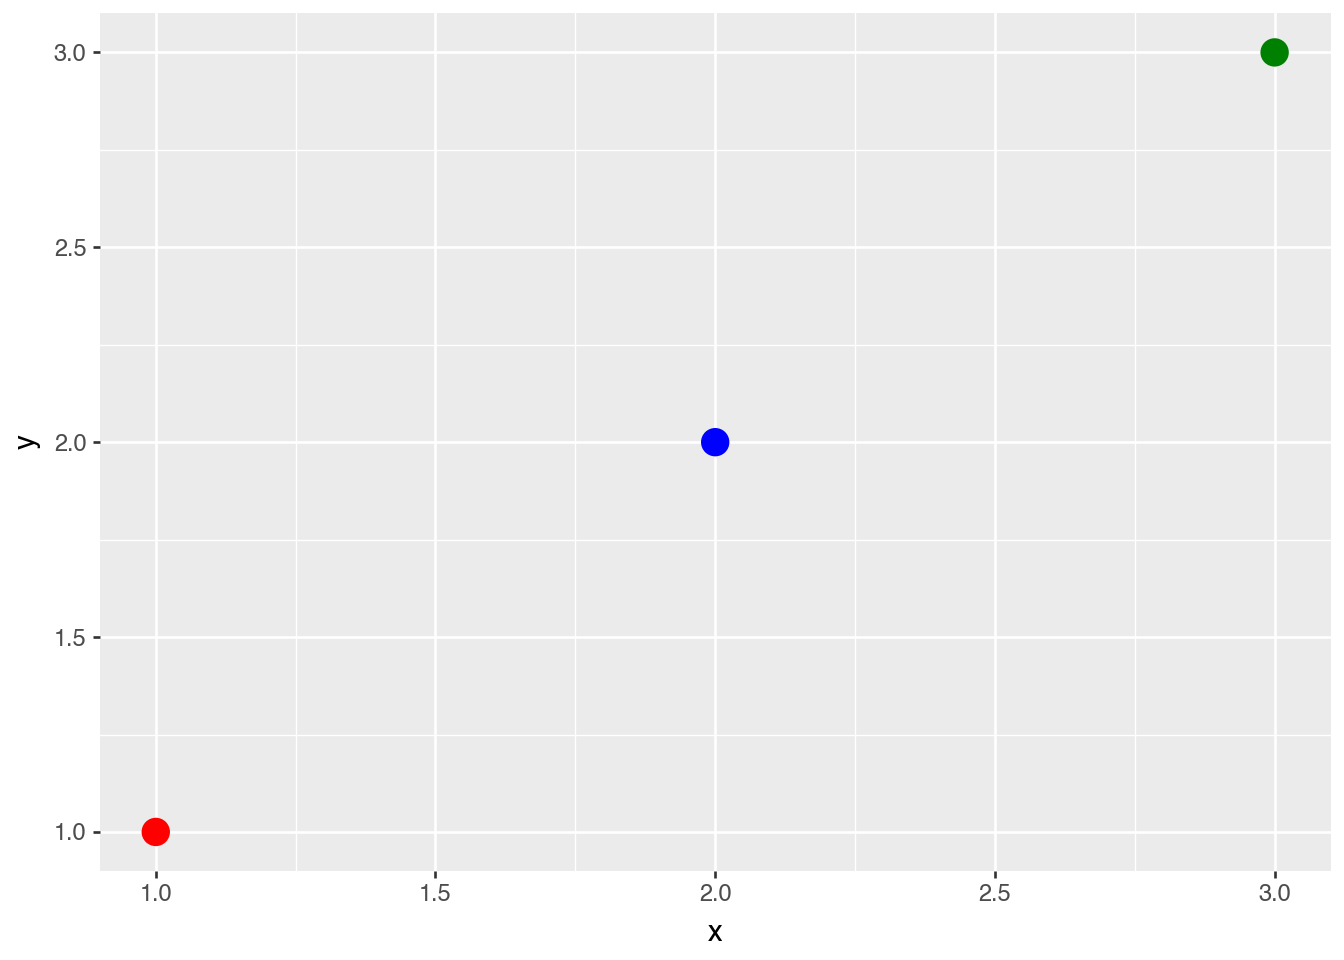
Identity Scales
df_identity = pl.DataFrame(
    {
        "x": [1, 2, 3],
        "y": [1, 2, 3],
        "my_color": ["red", "blue", "green"],
    }
)

(
    df_identity.ggplot()
    .aes("x", "y", color="my_color")
    .geom_point(size=5)
    .scale_color_identity()
)
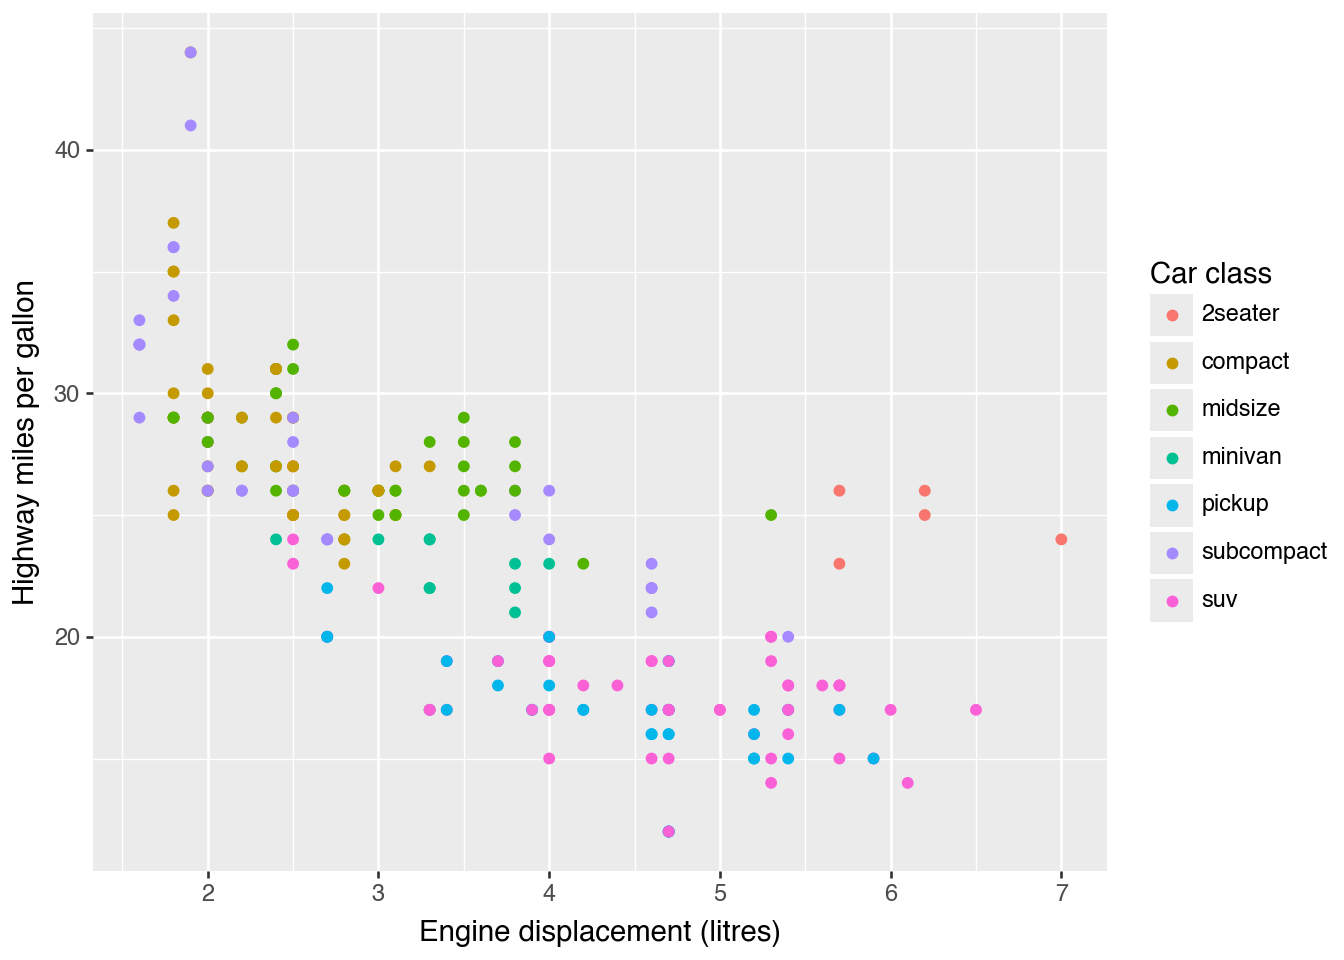
name= for Guide Labels
(
    mpg.ggplot()
    .aes("displ", "hwy", color="class")
    .geom_point()
    .scale_x_continuous(name="Engine displacement (litres)")
    .scale_y_continuous(name="Highway miles per gallon")
    .scale_color_discrete(name="Car class")
)
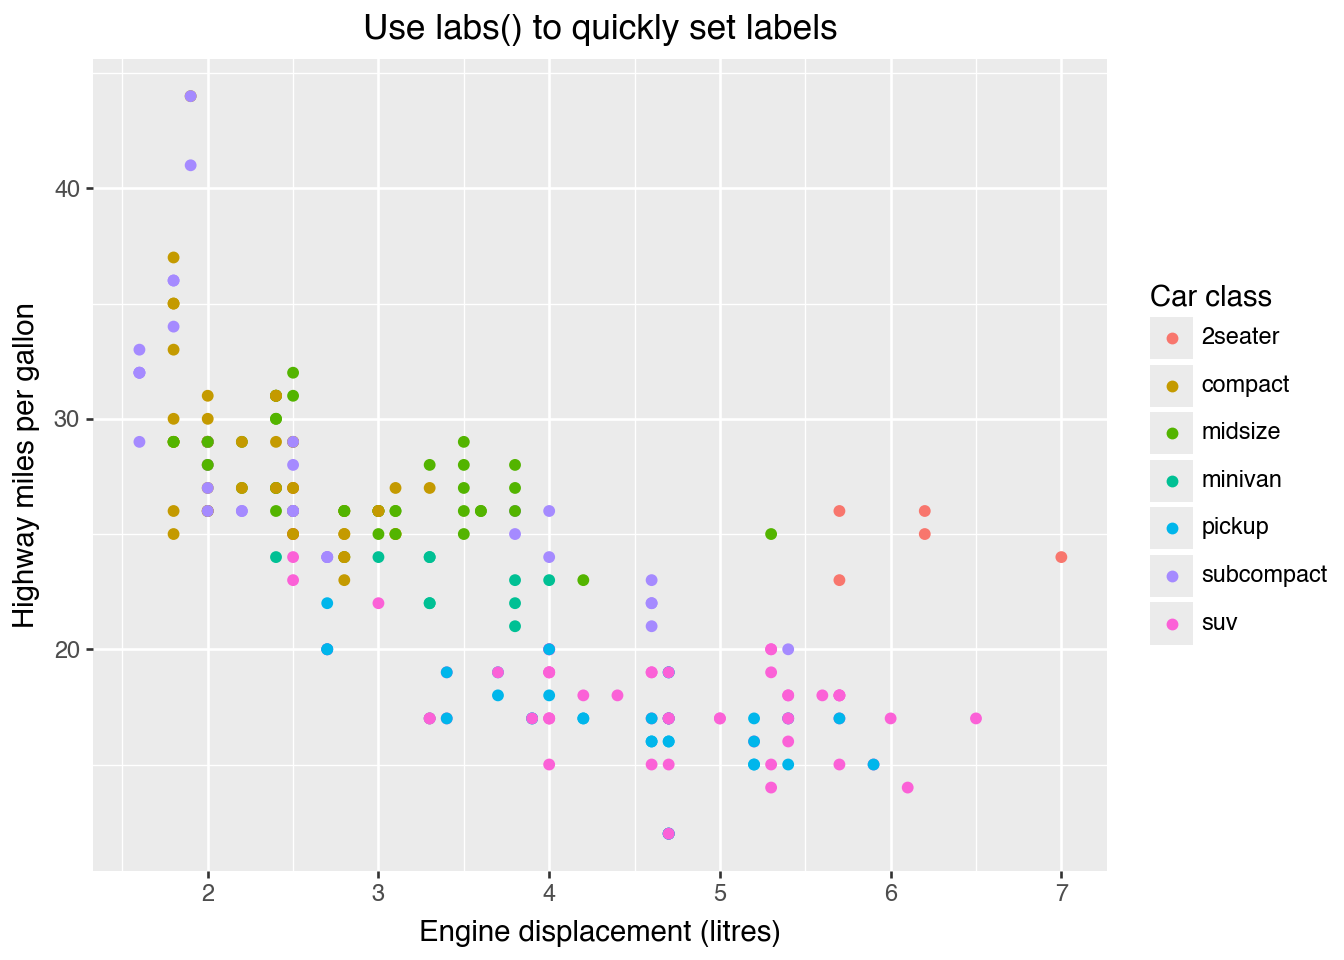
(
    mpg.ggplot()
    .aes("displ", "hwy", color="class")
    .geom_point()
    .xlab("Engine displacement (litres)")
    .labs(
        y="Highway miles per gallon",
        color="Car class",
        title="Use labs() to quickly set labels",
    )
)
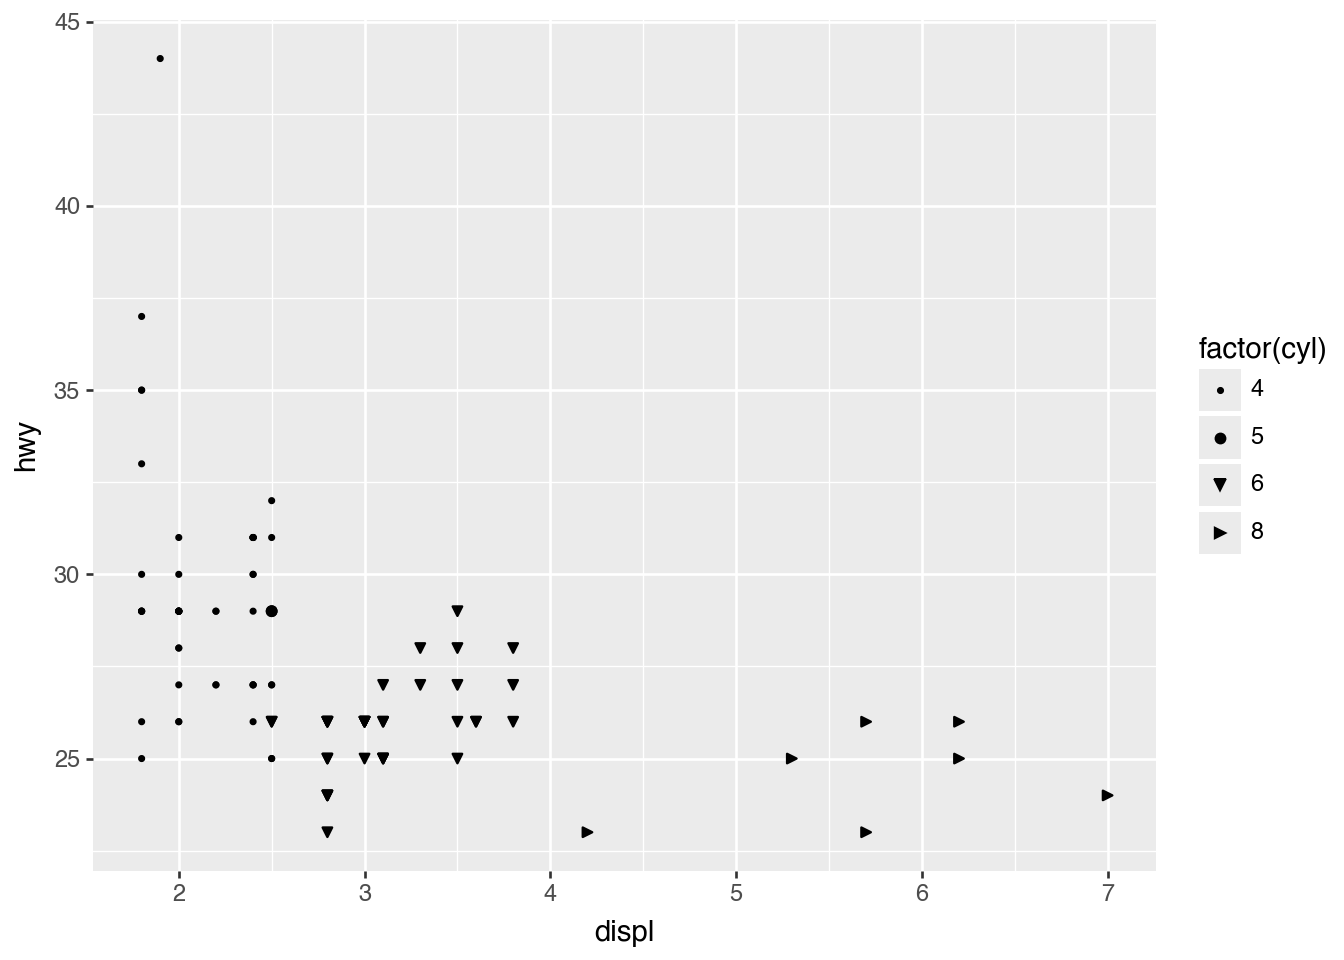
values= for Manual Styles
keep_classes = ["2seater", "compact", "midsize"]
filtered = mpg.filter(pl.col("class").is_in(keep_classes))

(
    filtered.ggplot()
    .aes("displ", "hwy", shape="factor(cyl)")
    .geom_point()
    .scale_shape_manual(values=[".", "o", "v", ">"])
)
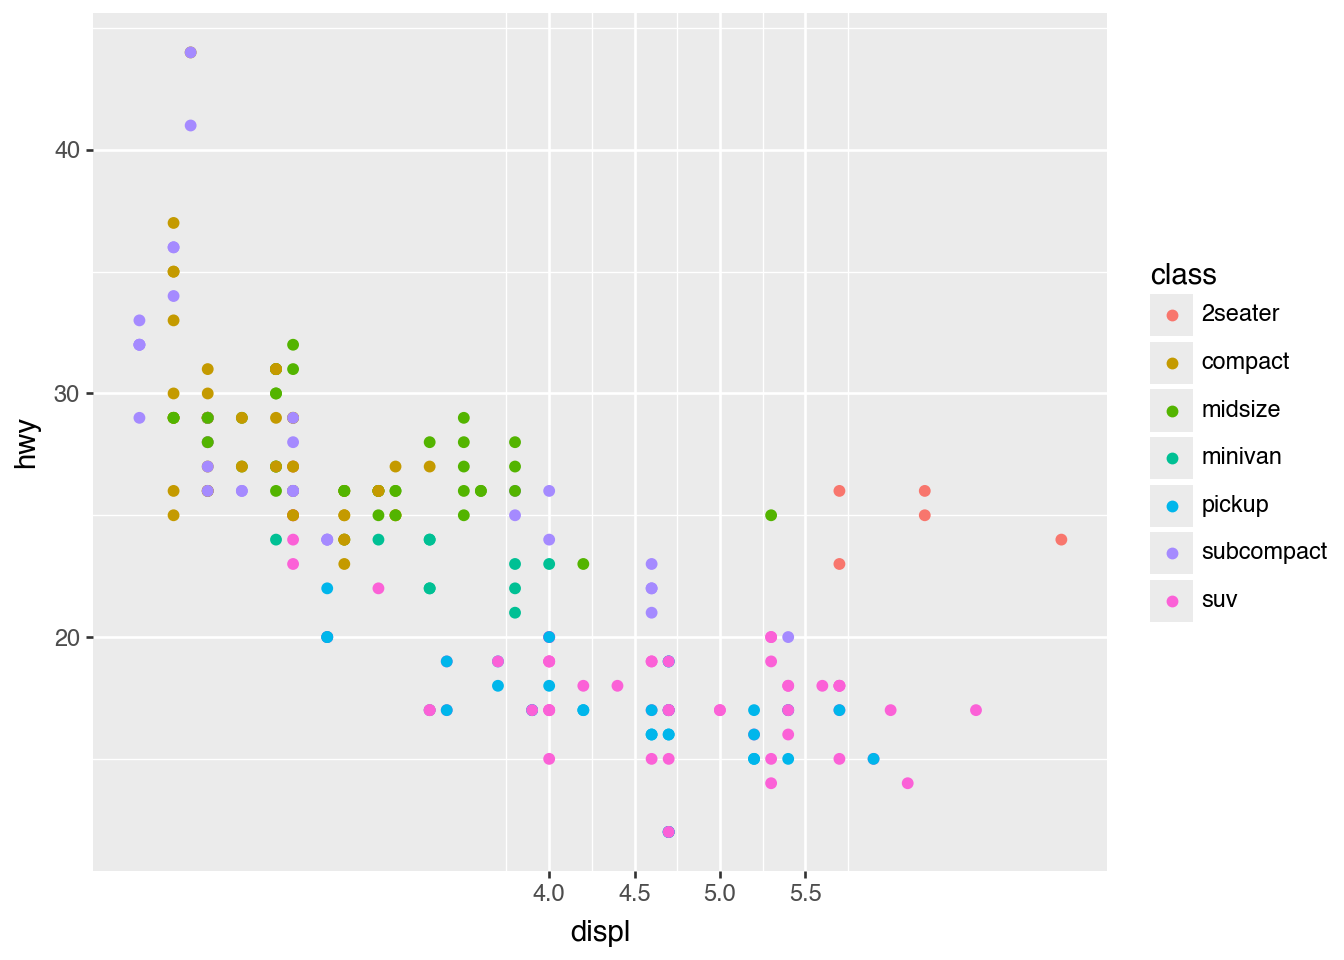
breaks= for Axis Ticks
(
    mpg.ggplot()
    .aes("displ", "hwy", color="class")
    .geom_point()
    .scale_x_continuous(breaks=[4, 4.5, 5, 5.5])
)
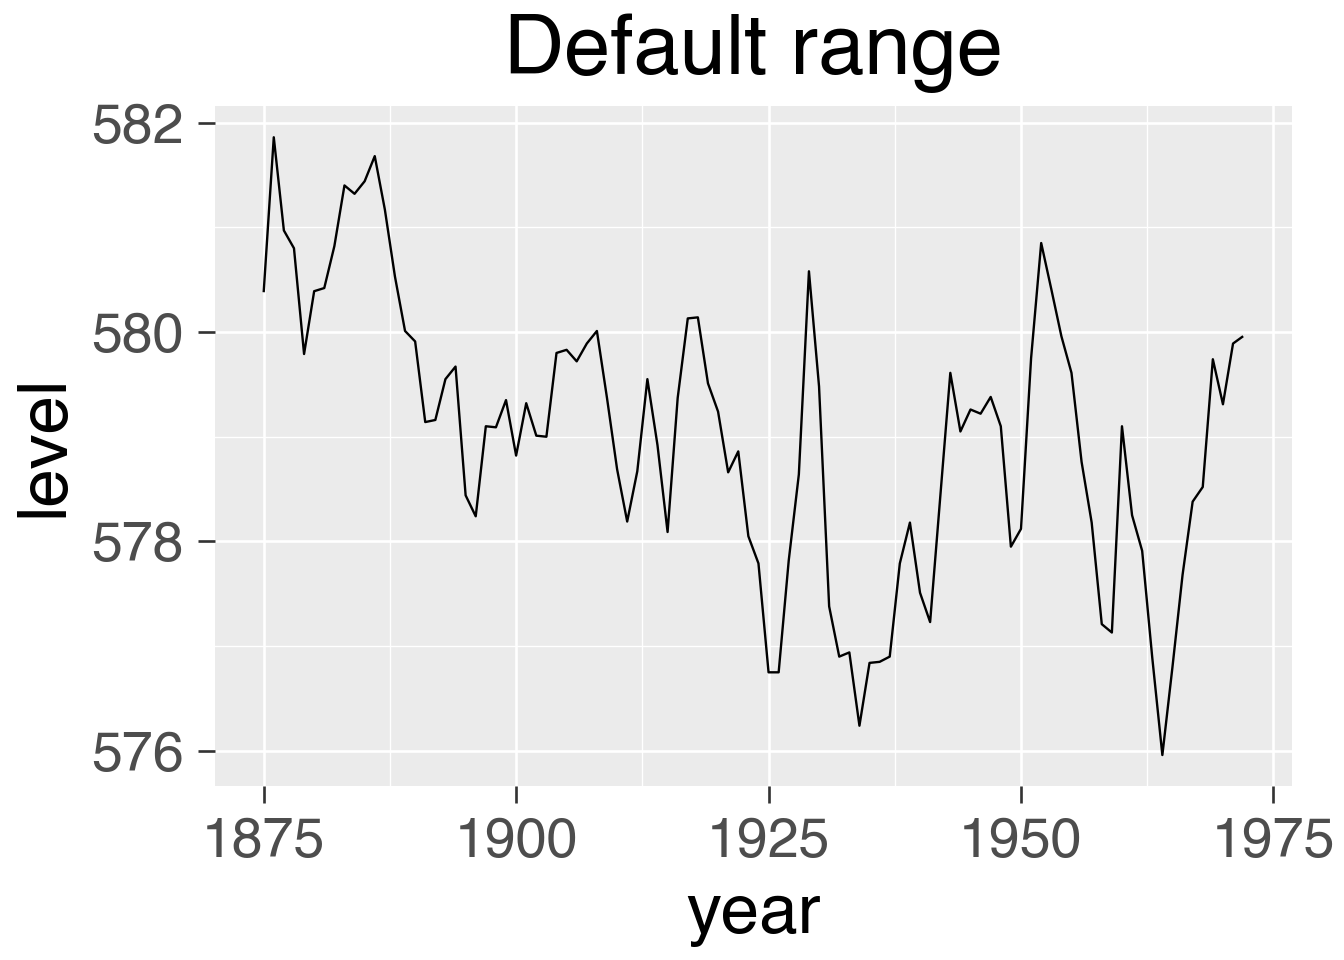
limits= for Restricting Range
huron_plot = (
    huron.ggplot()
    .aes("year", "level")
    .geom_line()
    .theme_grey(base_size=26)
)

(
    huron_plot
    .labs(title="Default range")
)
(
    huron_plot
    .scale_x_continuous(limits=[1950, 1960])
    .labs(title="Zoom in")
)
/Users/igow/git/plotnine/plotnine/geoms/geom_path.py:98: PlotnineWarning: geom_line: Removed 87 rows containing missing values.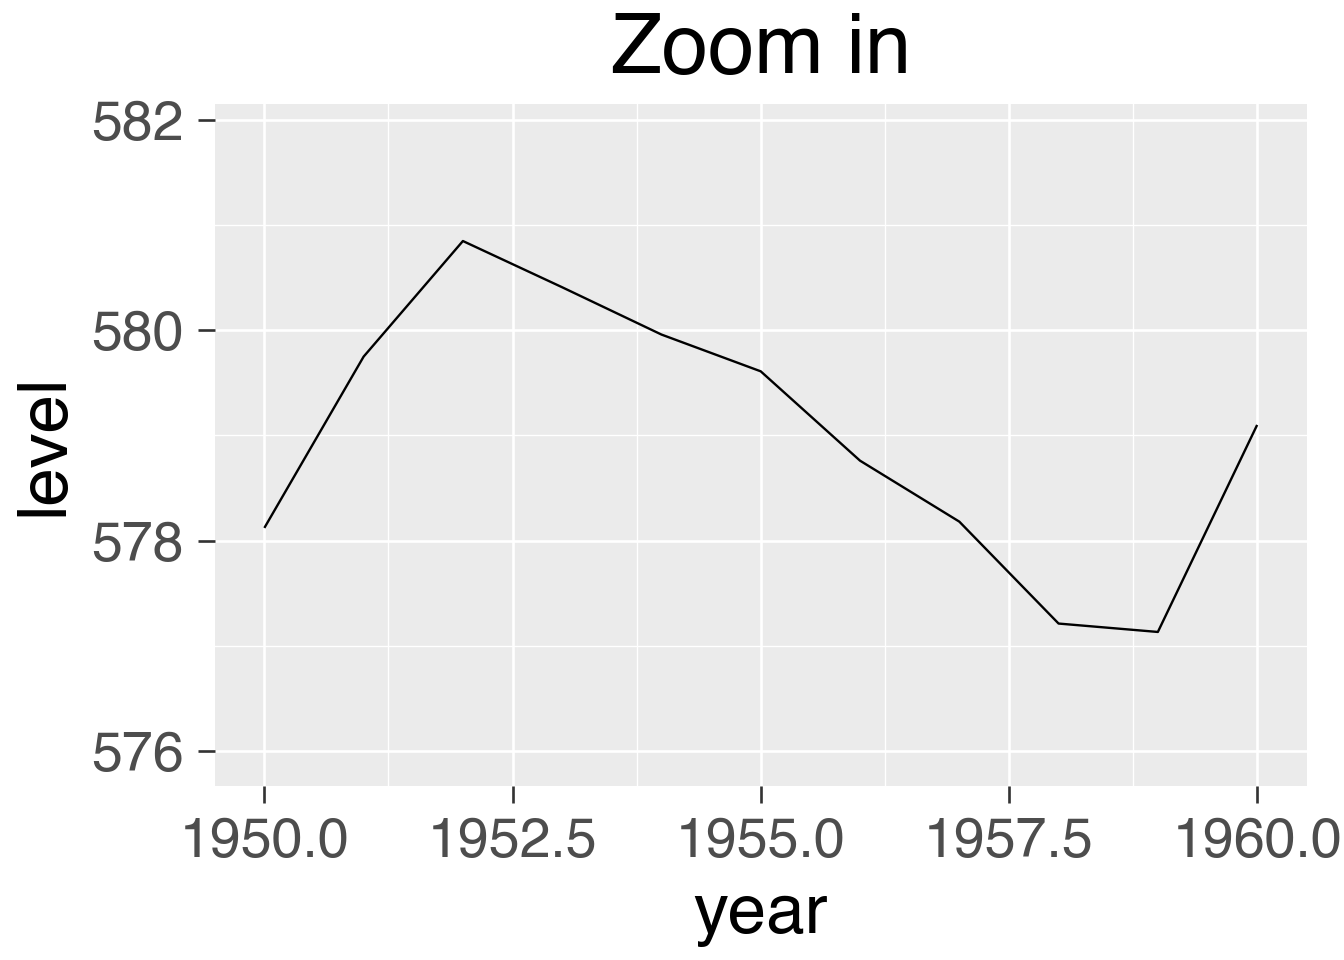
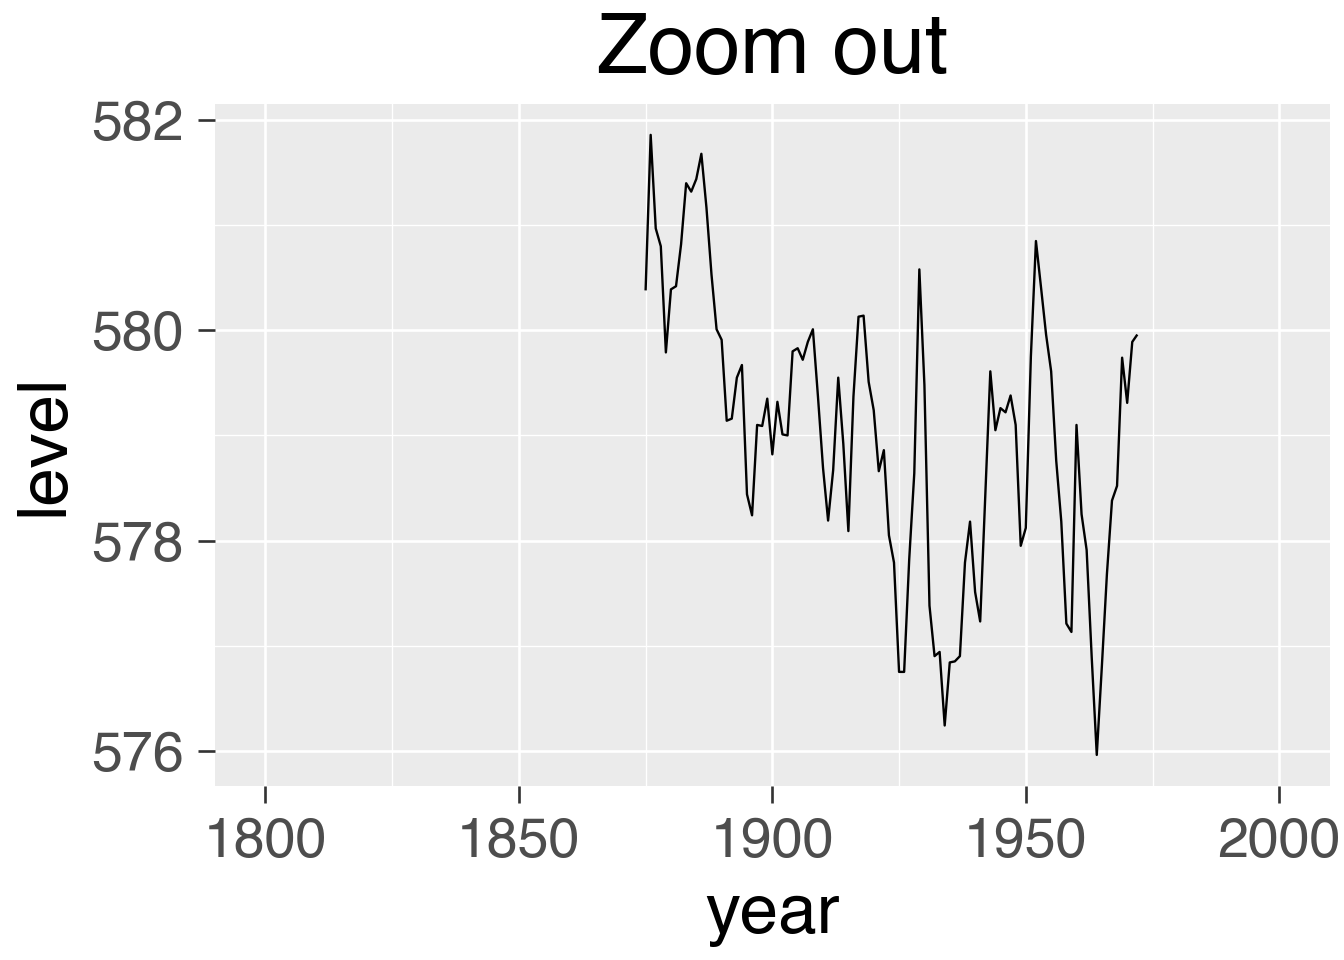
(
    huron_plot
    .scale_x_continuous(limits=[1800, 2000])
    .labs(title="Zoom out")
)
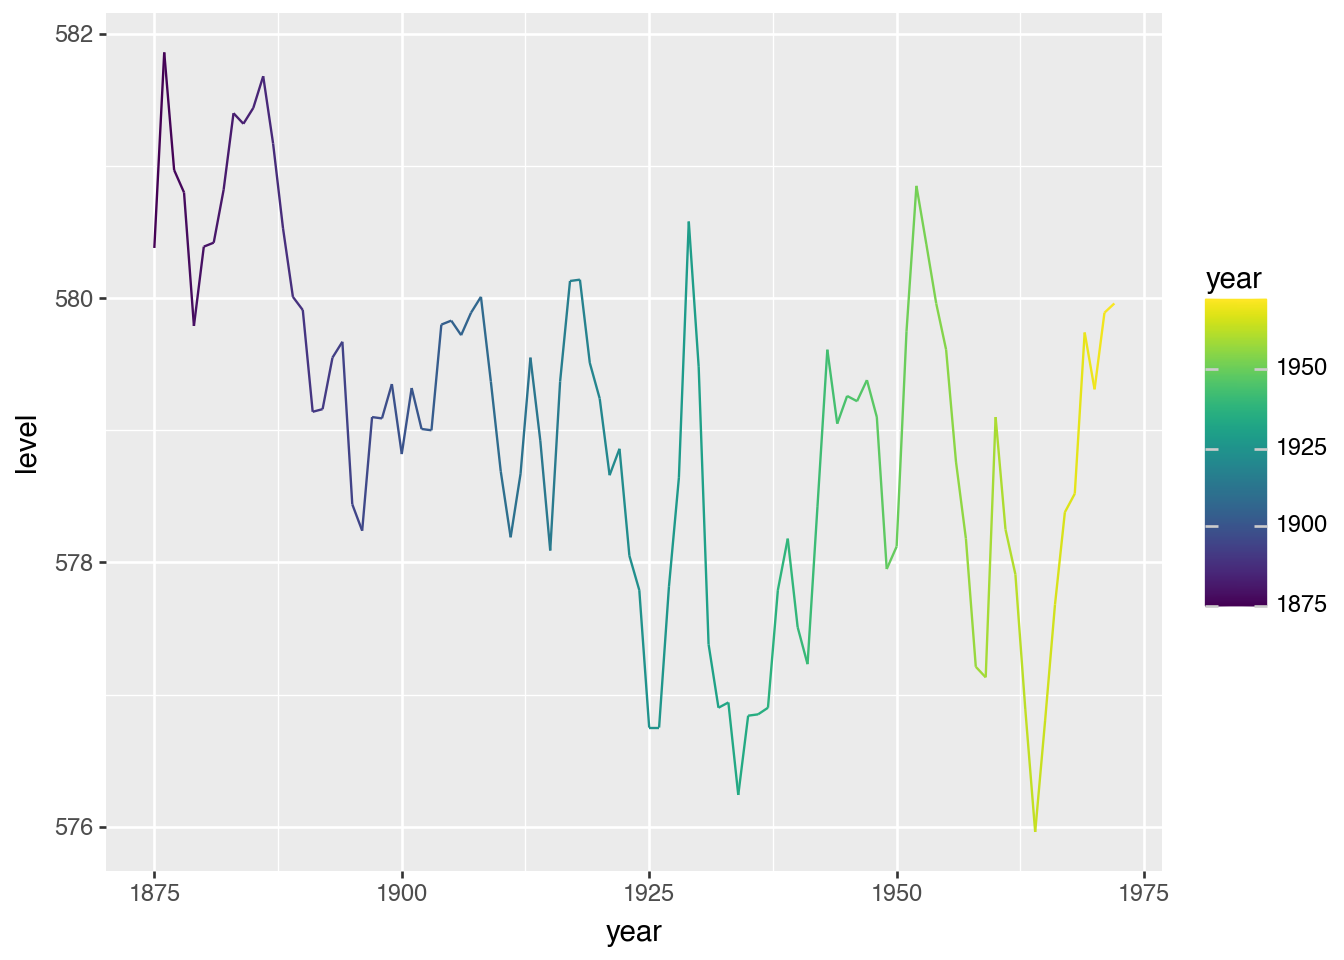
(
    huron.ggplot()
    .aes("year", "level", color="year")
    .geom_line()
)
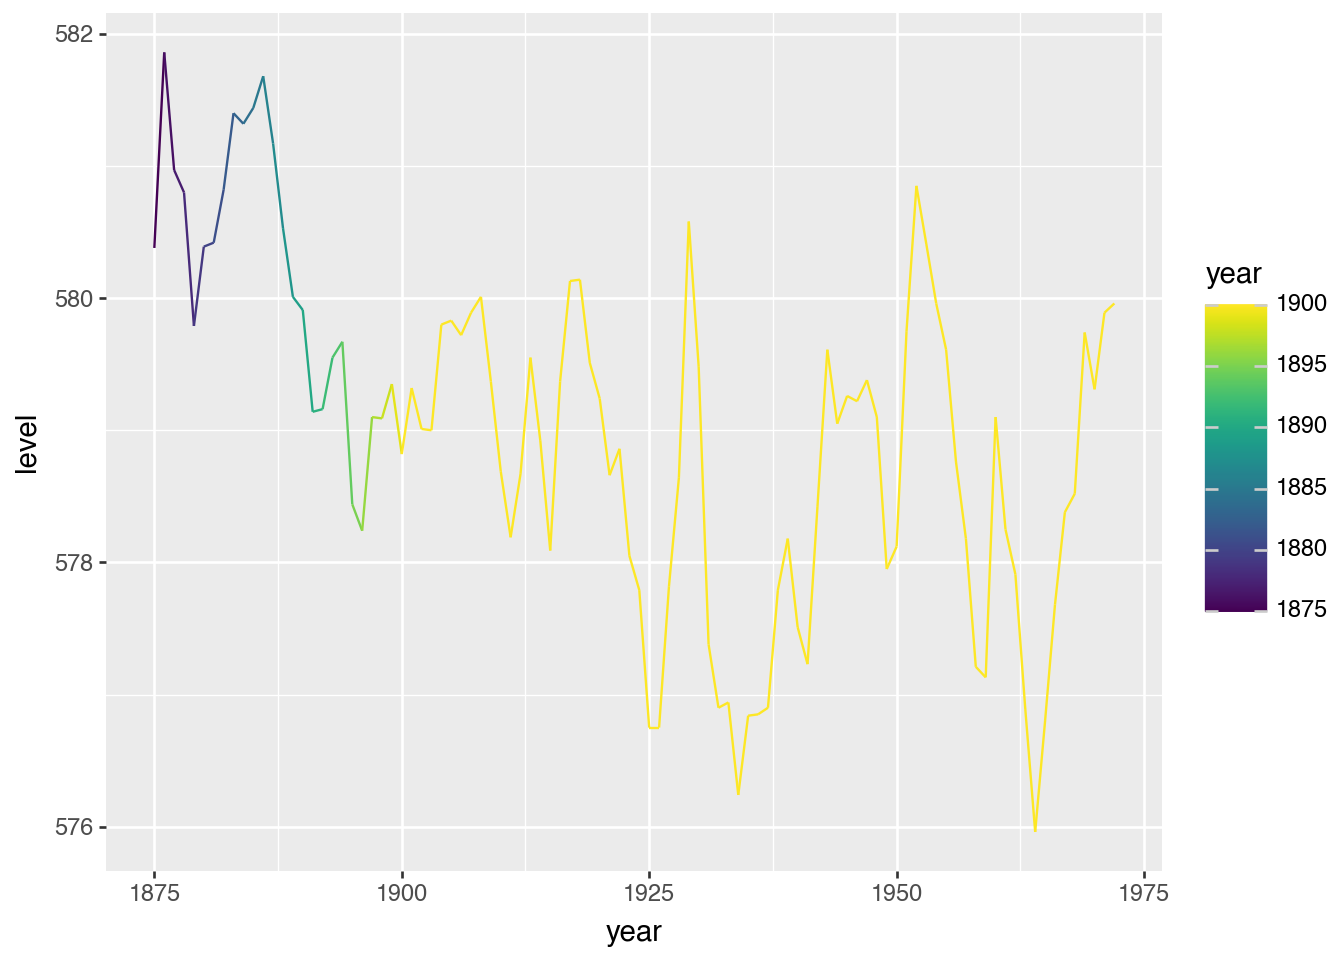
(
    huron.ggplot()
    .aes("year", "level", color="year")
    .geom_line()
    .scale_color_continuous(limits=[None, 1900])
)
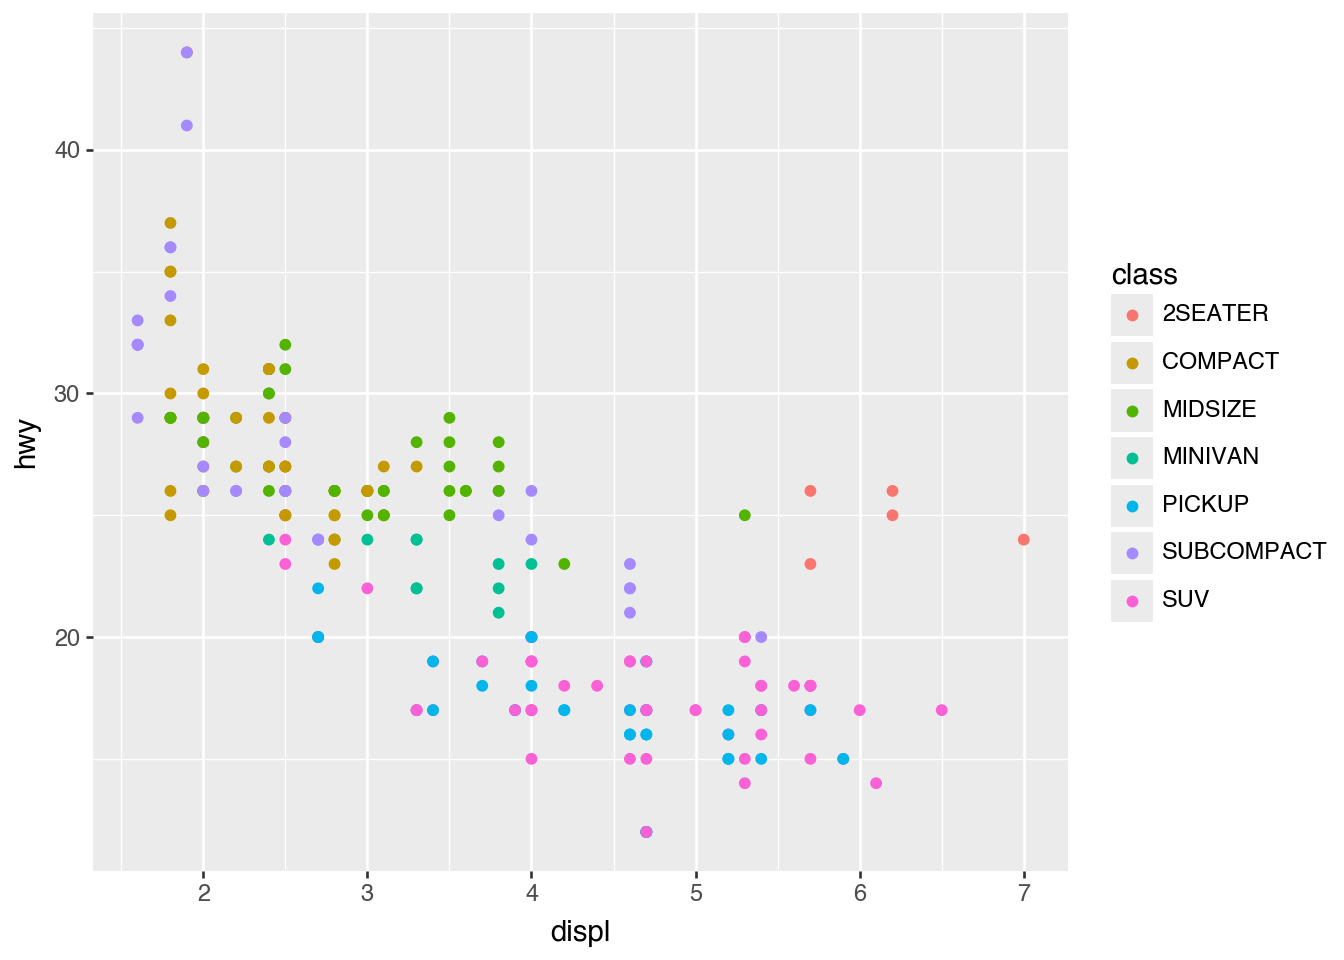
labels= for Break Labels
(
    mpg.ggplot()
    .aes("displ", "hwy", color="class")
    .geom_point()
    .scale_color_discrete(labels=lambda breaks: [s.upper() for s in breaks])
)
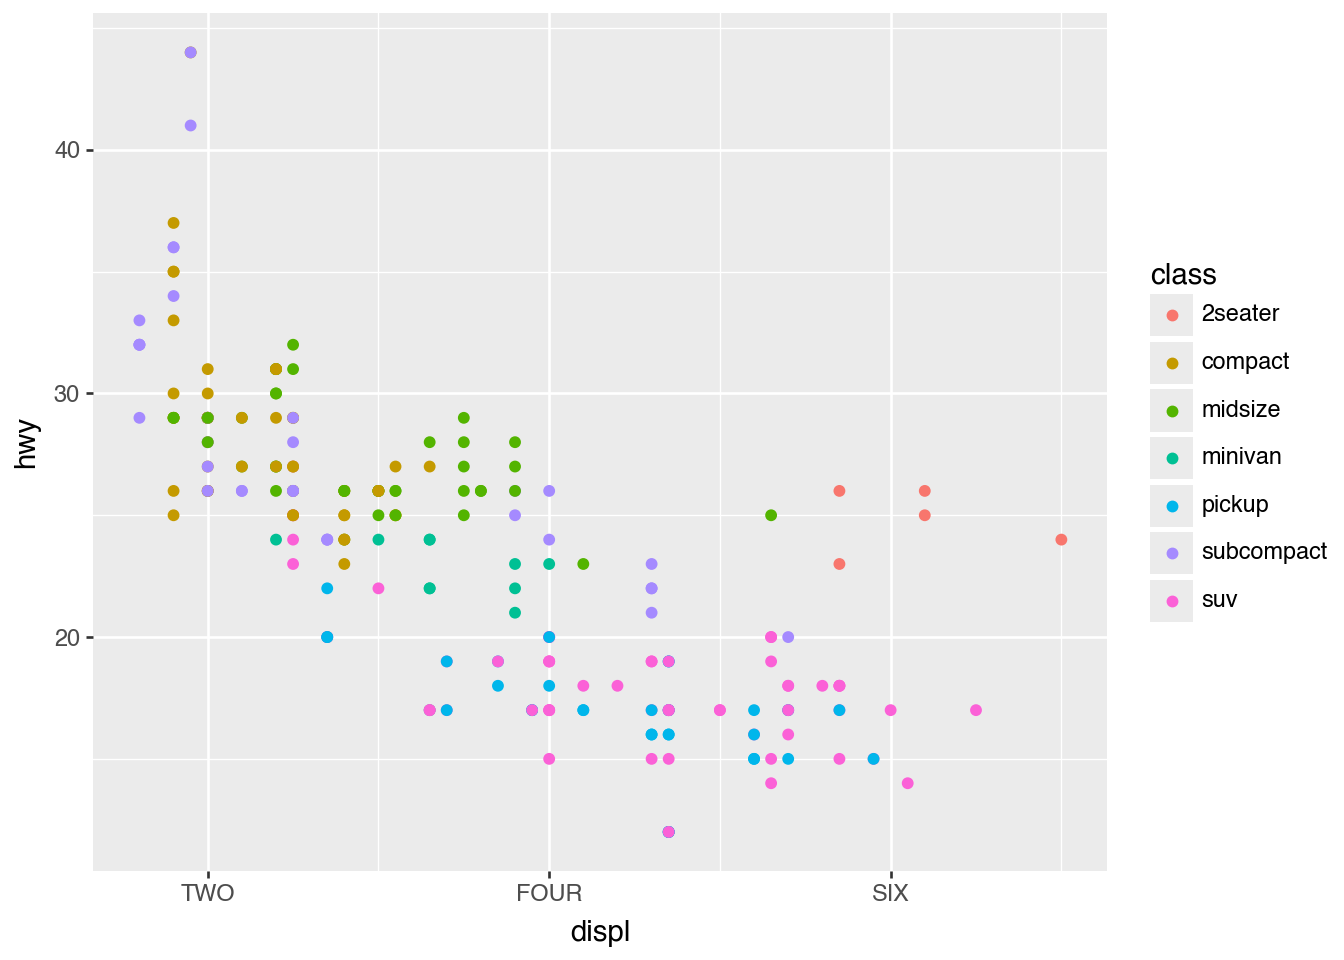
(
    mpg.ggplot()
    .aes("displ", "hwy", color="class")
    .geom_point()
    .scale_x_continuous(breaks=[2, 4, 6], labels=["TWO", "FOUR", "SIX"])
)
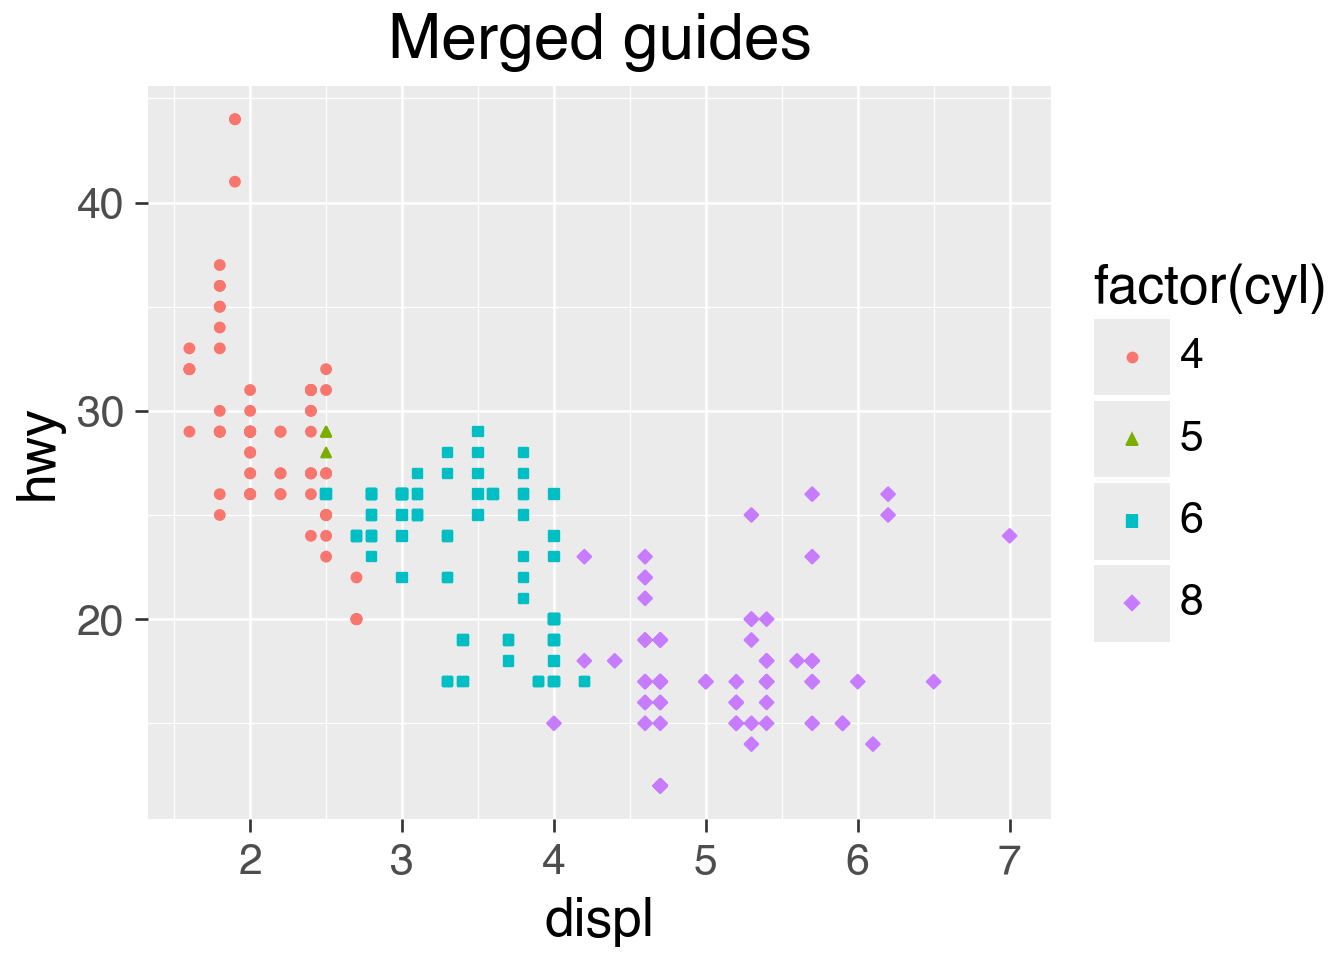
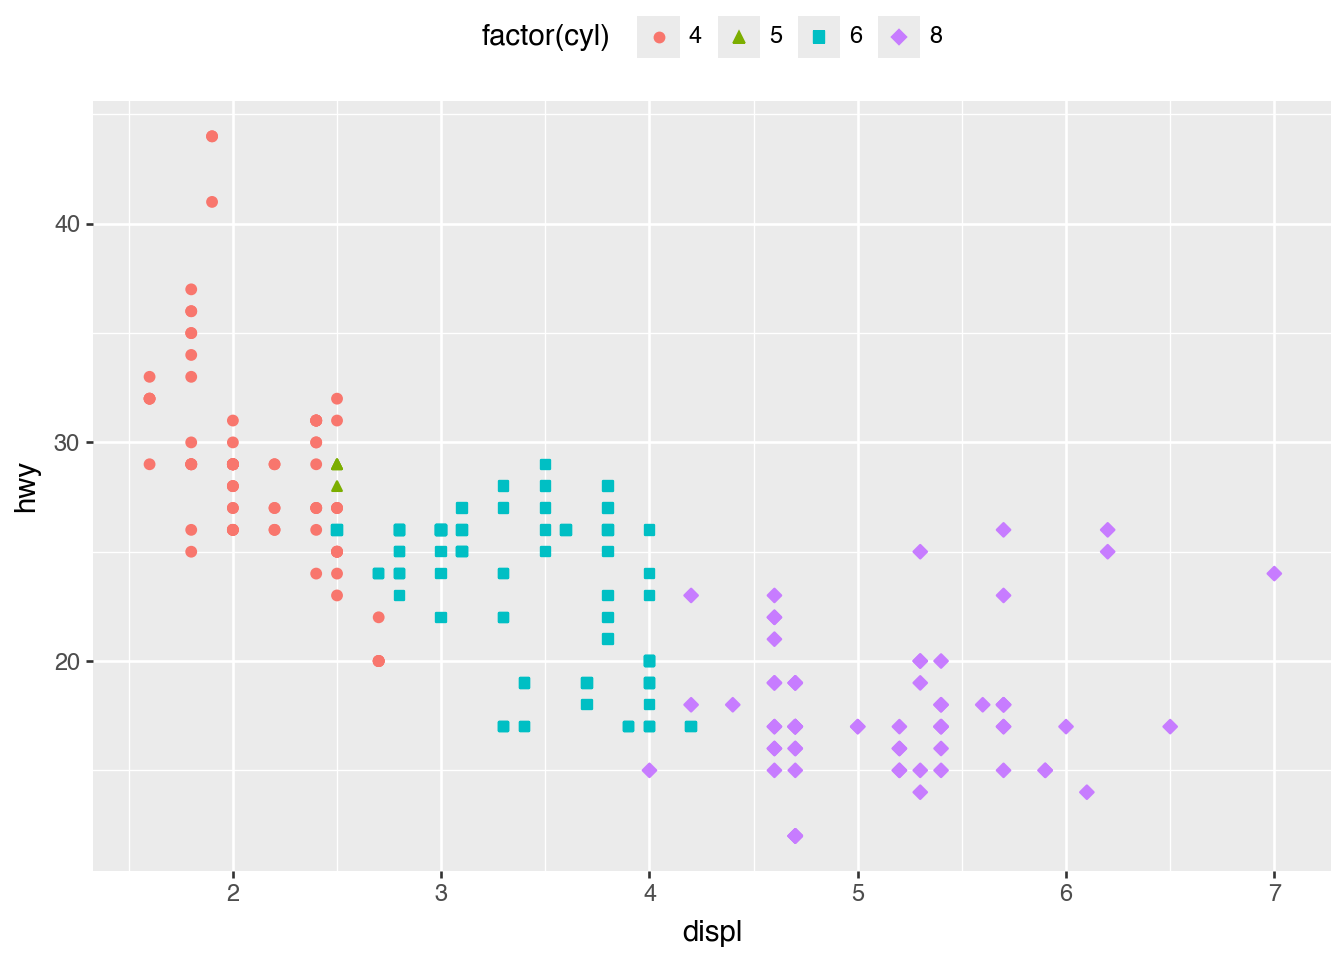
Legend Merging
merged_legend_plot = (
    mpg.ggplot()
    .aes("displ", "hwy", color="factor(cyl)", shape="factor(cyl)")
    .geom_point()
    .theme_grey(base_size=20)
)

(
    merged_legend_plot
    .labs(title="Merged guides")
)
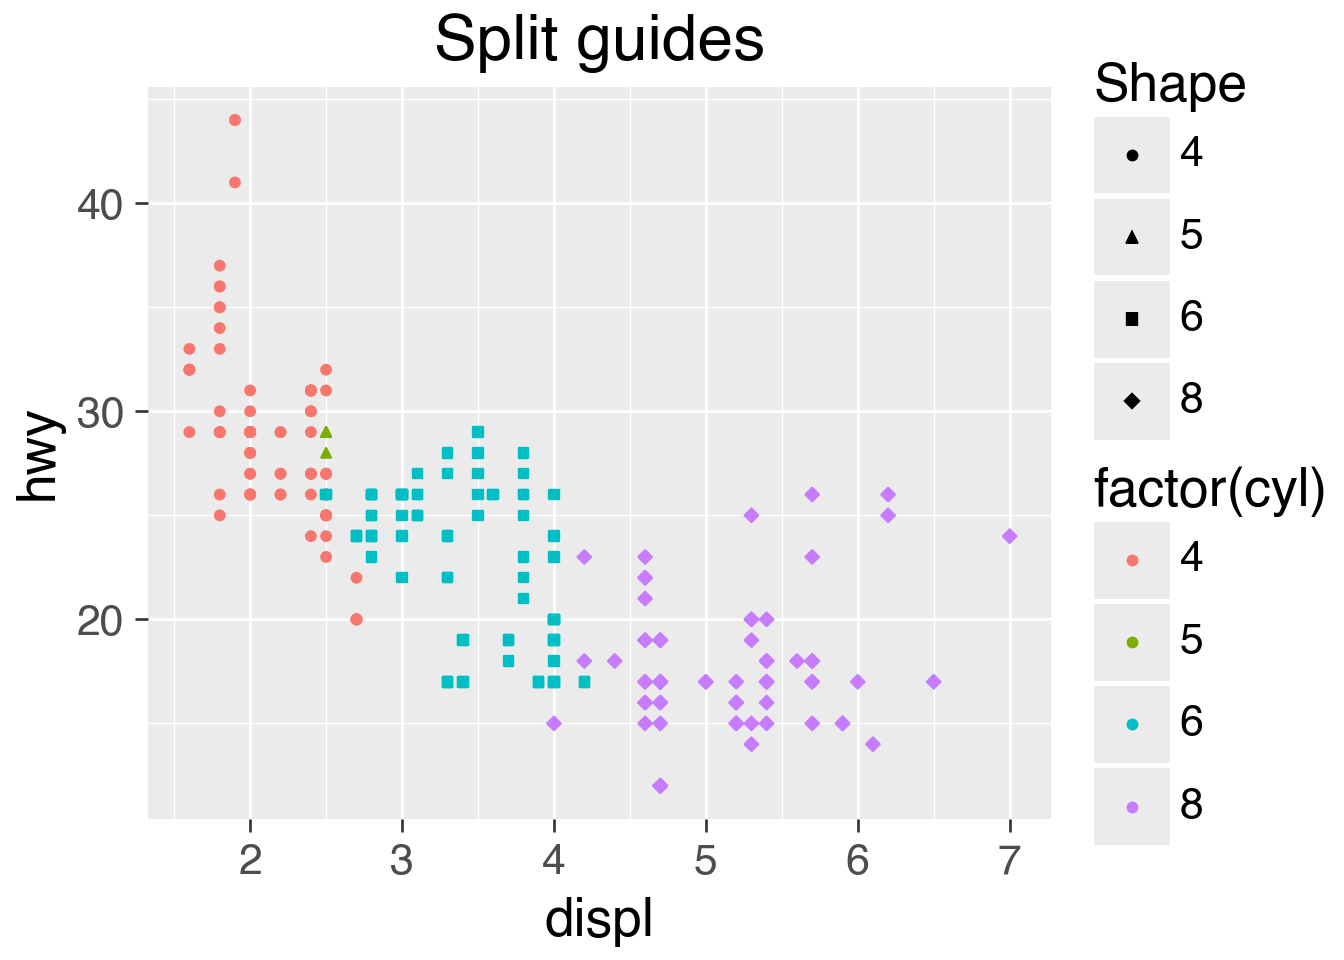
(
    merged_legend_plot
    .labs(title="Split guides")
    .scale_shape_discrete(name="Shape")
)
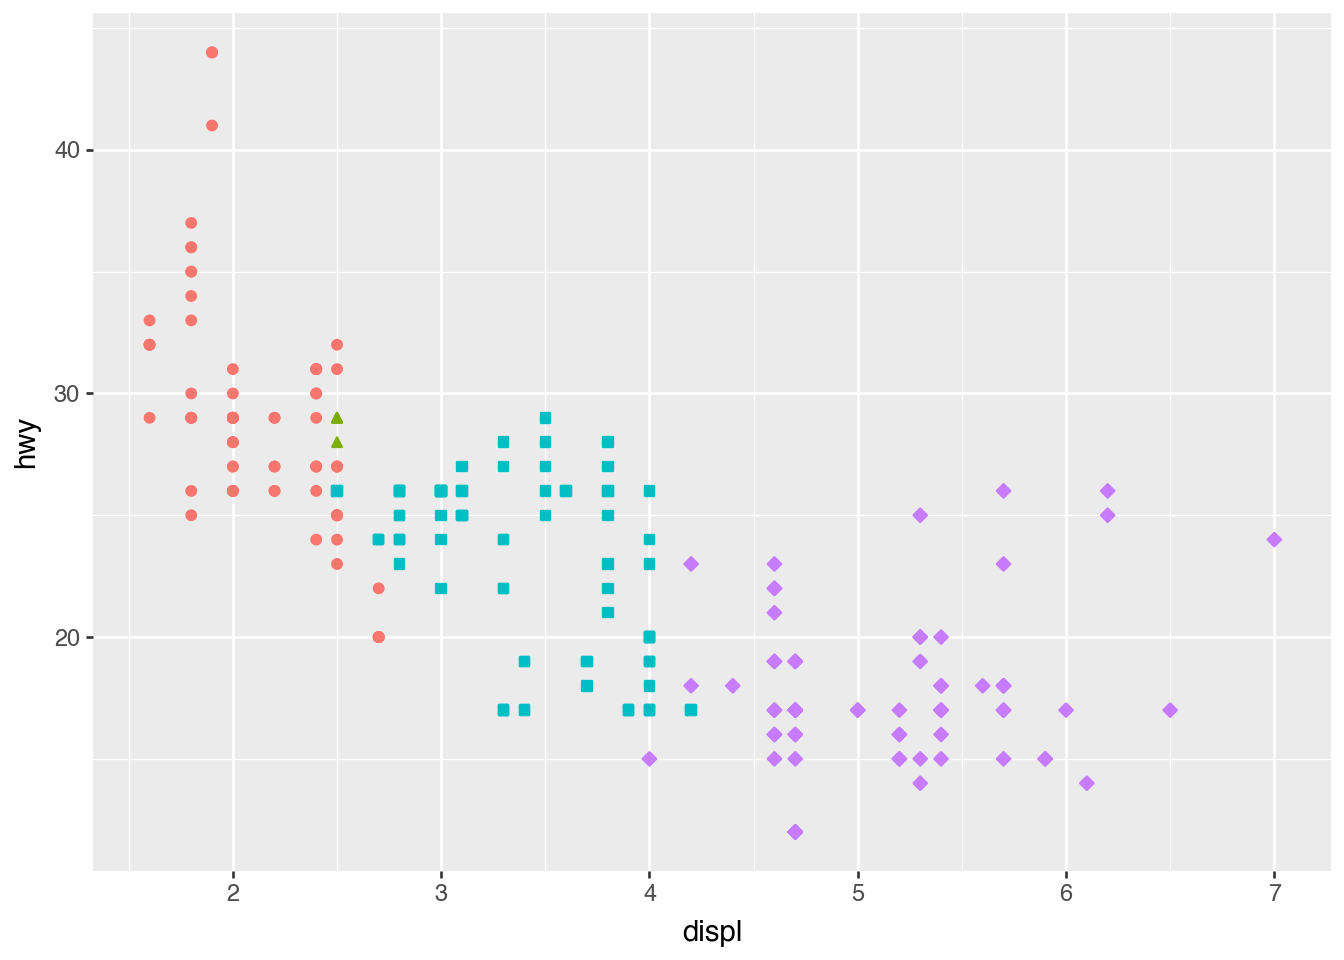
Legend Position
legend_position_plot = (
    mpg.ggplot()
    .aes("displ", "hwy", color="factor(cyl)", shape="factor(cyl)")
    .geom_point()
)

(
    legend_position_plot
    .add_theme(legend_position="top")
)
(
    legend_position_plot
    .add_theme(legend_position="none")
)
Guide Customization
guide_plot = (
    mpg.ggplot()
    .aes("displ", "hwy", color="cyl")
    .geom_point()
    .add_theme(legend_key_size=30)
)

guide_plot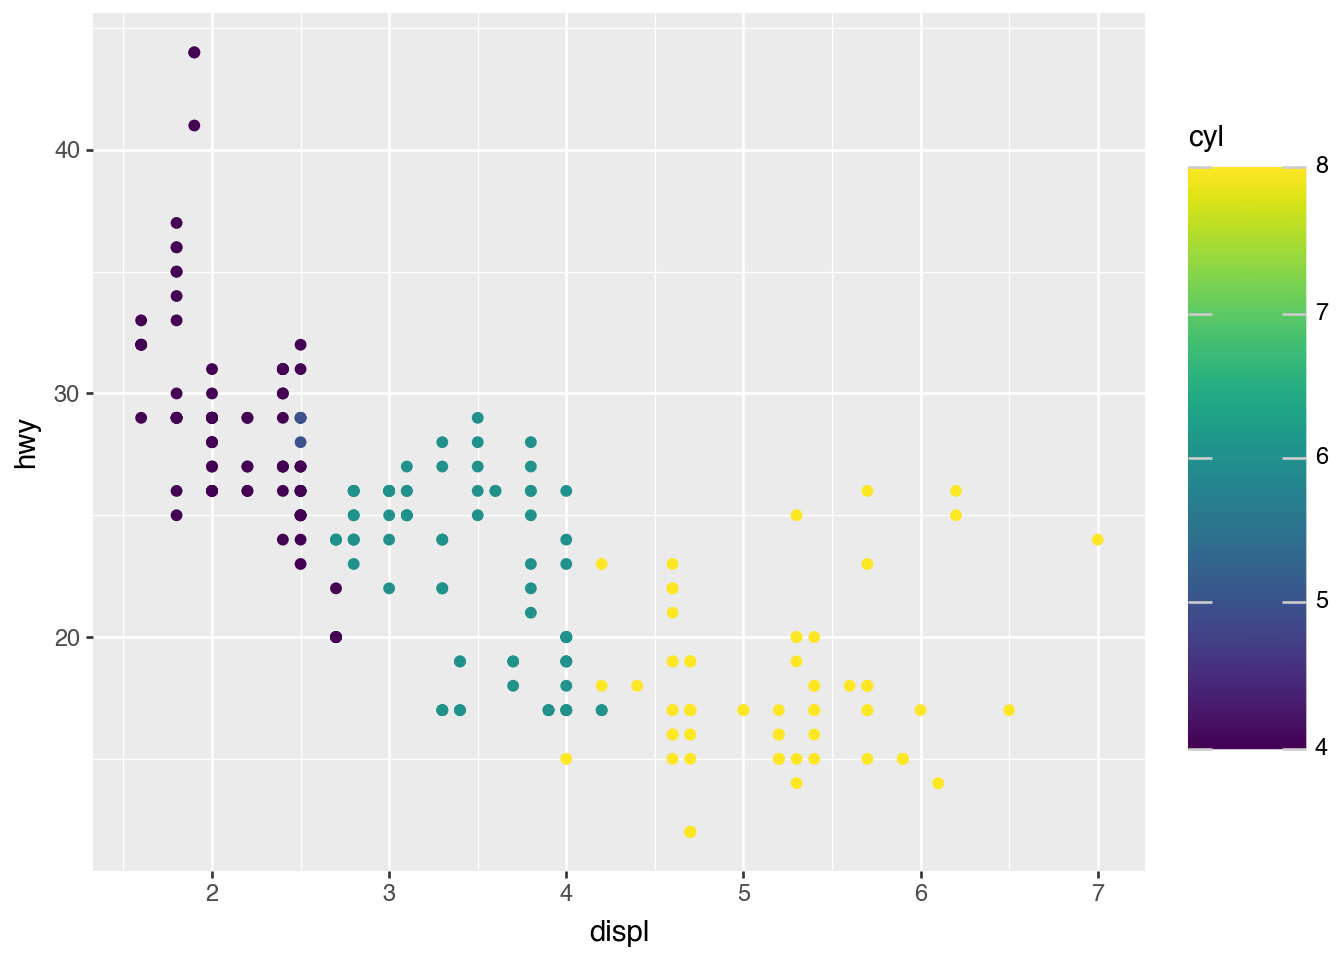
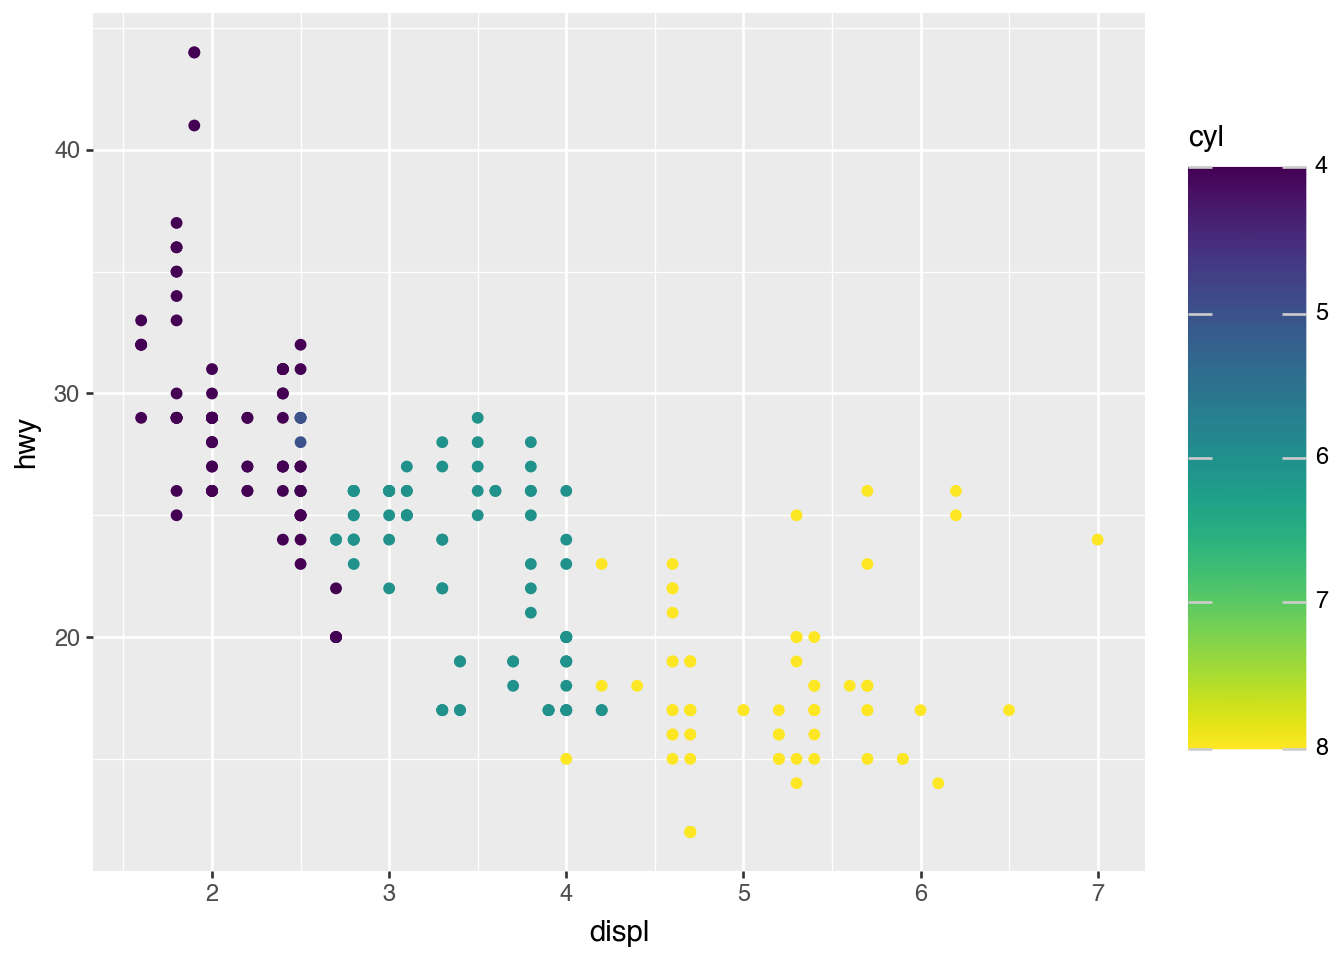
(
    guide_plot
    .add_guides(color=p9.guide_colorbar(reverse=True))
)
guide_df = pl.DataFrame(
{
"x": list(map(str, range(5))),
"y": list(map(str, range(5))),
"p": list(map(str, range(5))),
"q": list(map(str, range(5))),
"r": list(map(str, range(5))),
}
)
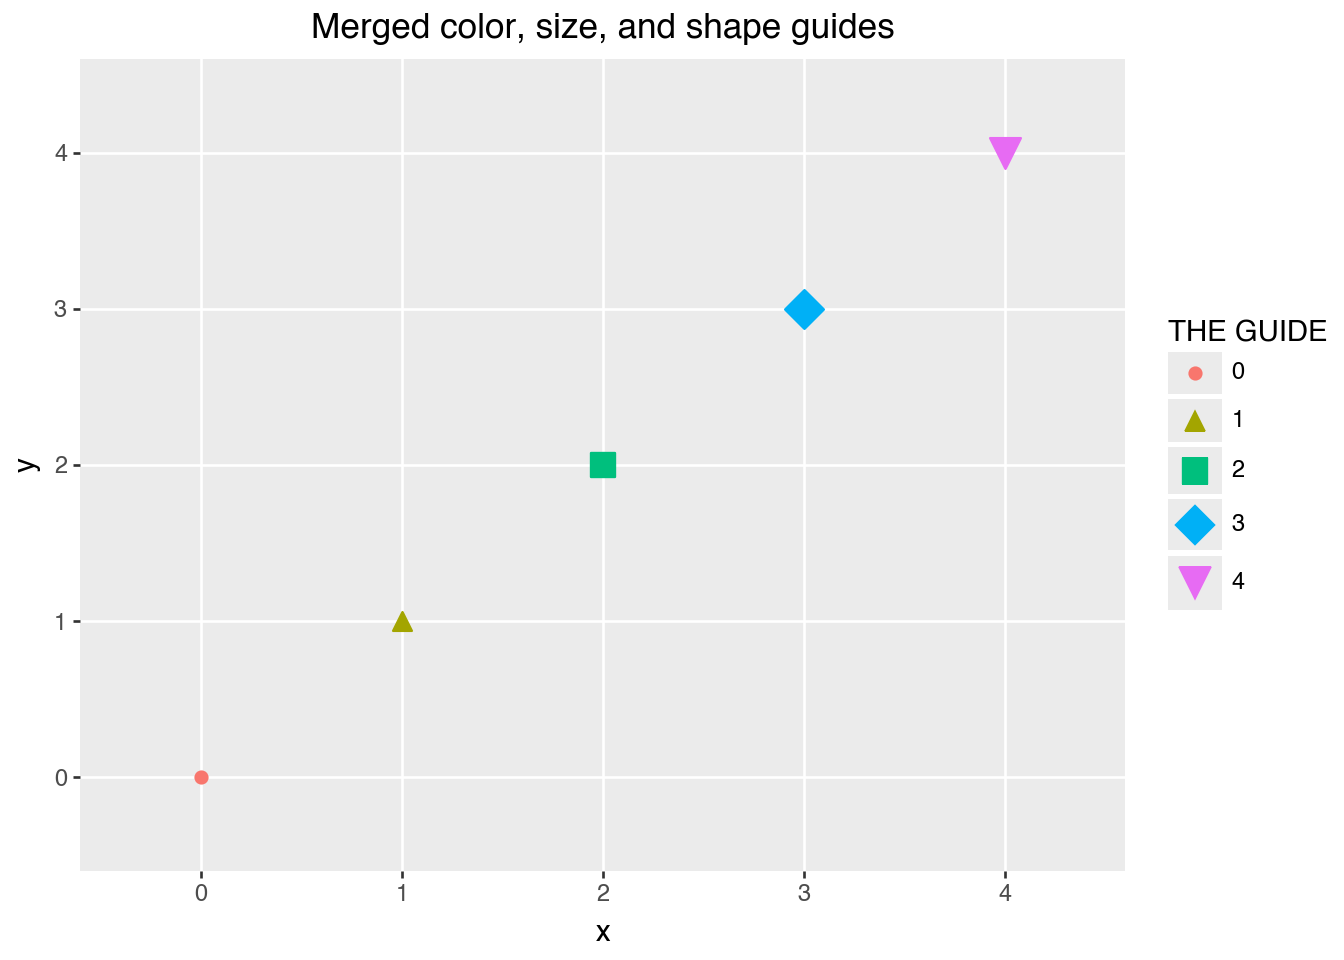
(
guide_df.ggplot()
.aes("x", "y", color="p", size="q", shape="r")
.geom_point()
.labs(title="Merged color, size, and shape guides")
.add_guides(
color=p9.guide_legend("THE GUIDE"),
size=p9.guide_legend("THE GUIDE"),
shape=p9.guide_legend("THE GUIDE"),
)
)/Users/igow/git/plotnine/plotnine/scales/scale_size.py:46: PlotnineWarning: Using size for a discrete variable is not advised.