import polars as pl
import plotnine_polars
from plotnine import aes, element_rect, element_textNYC Neighborhoods and Citi Bike Stations
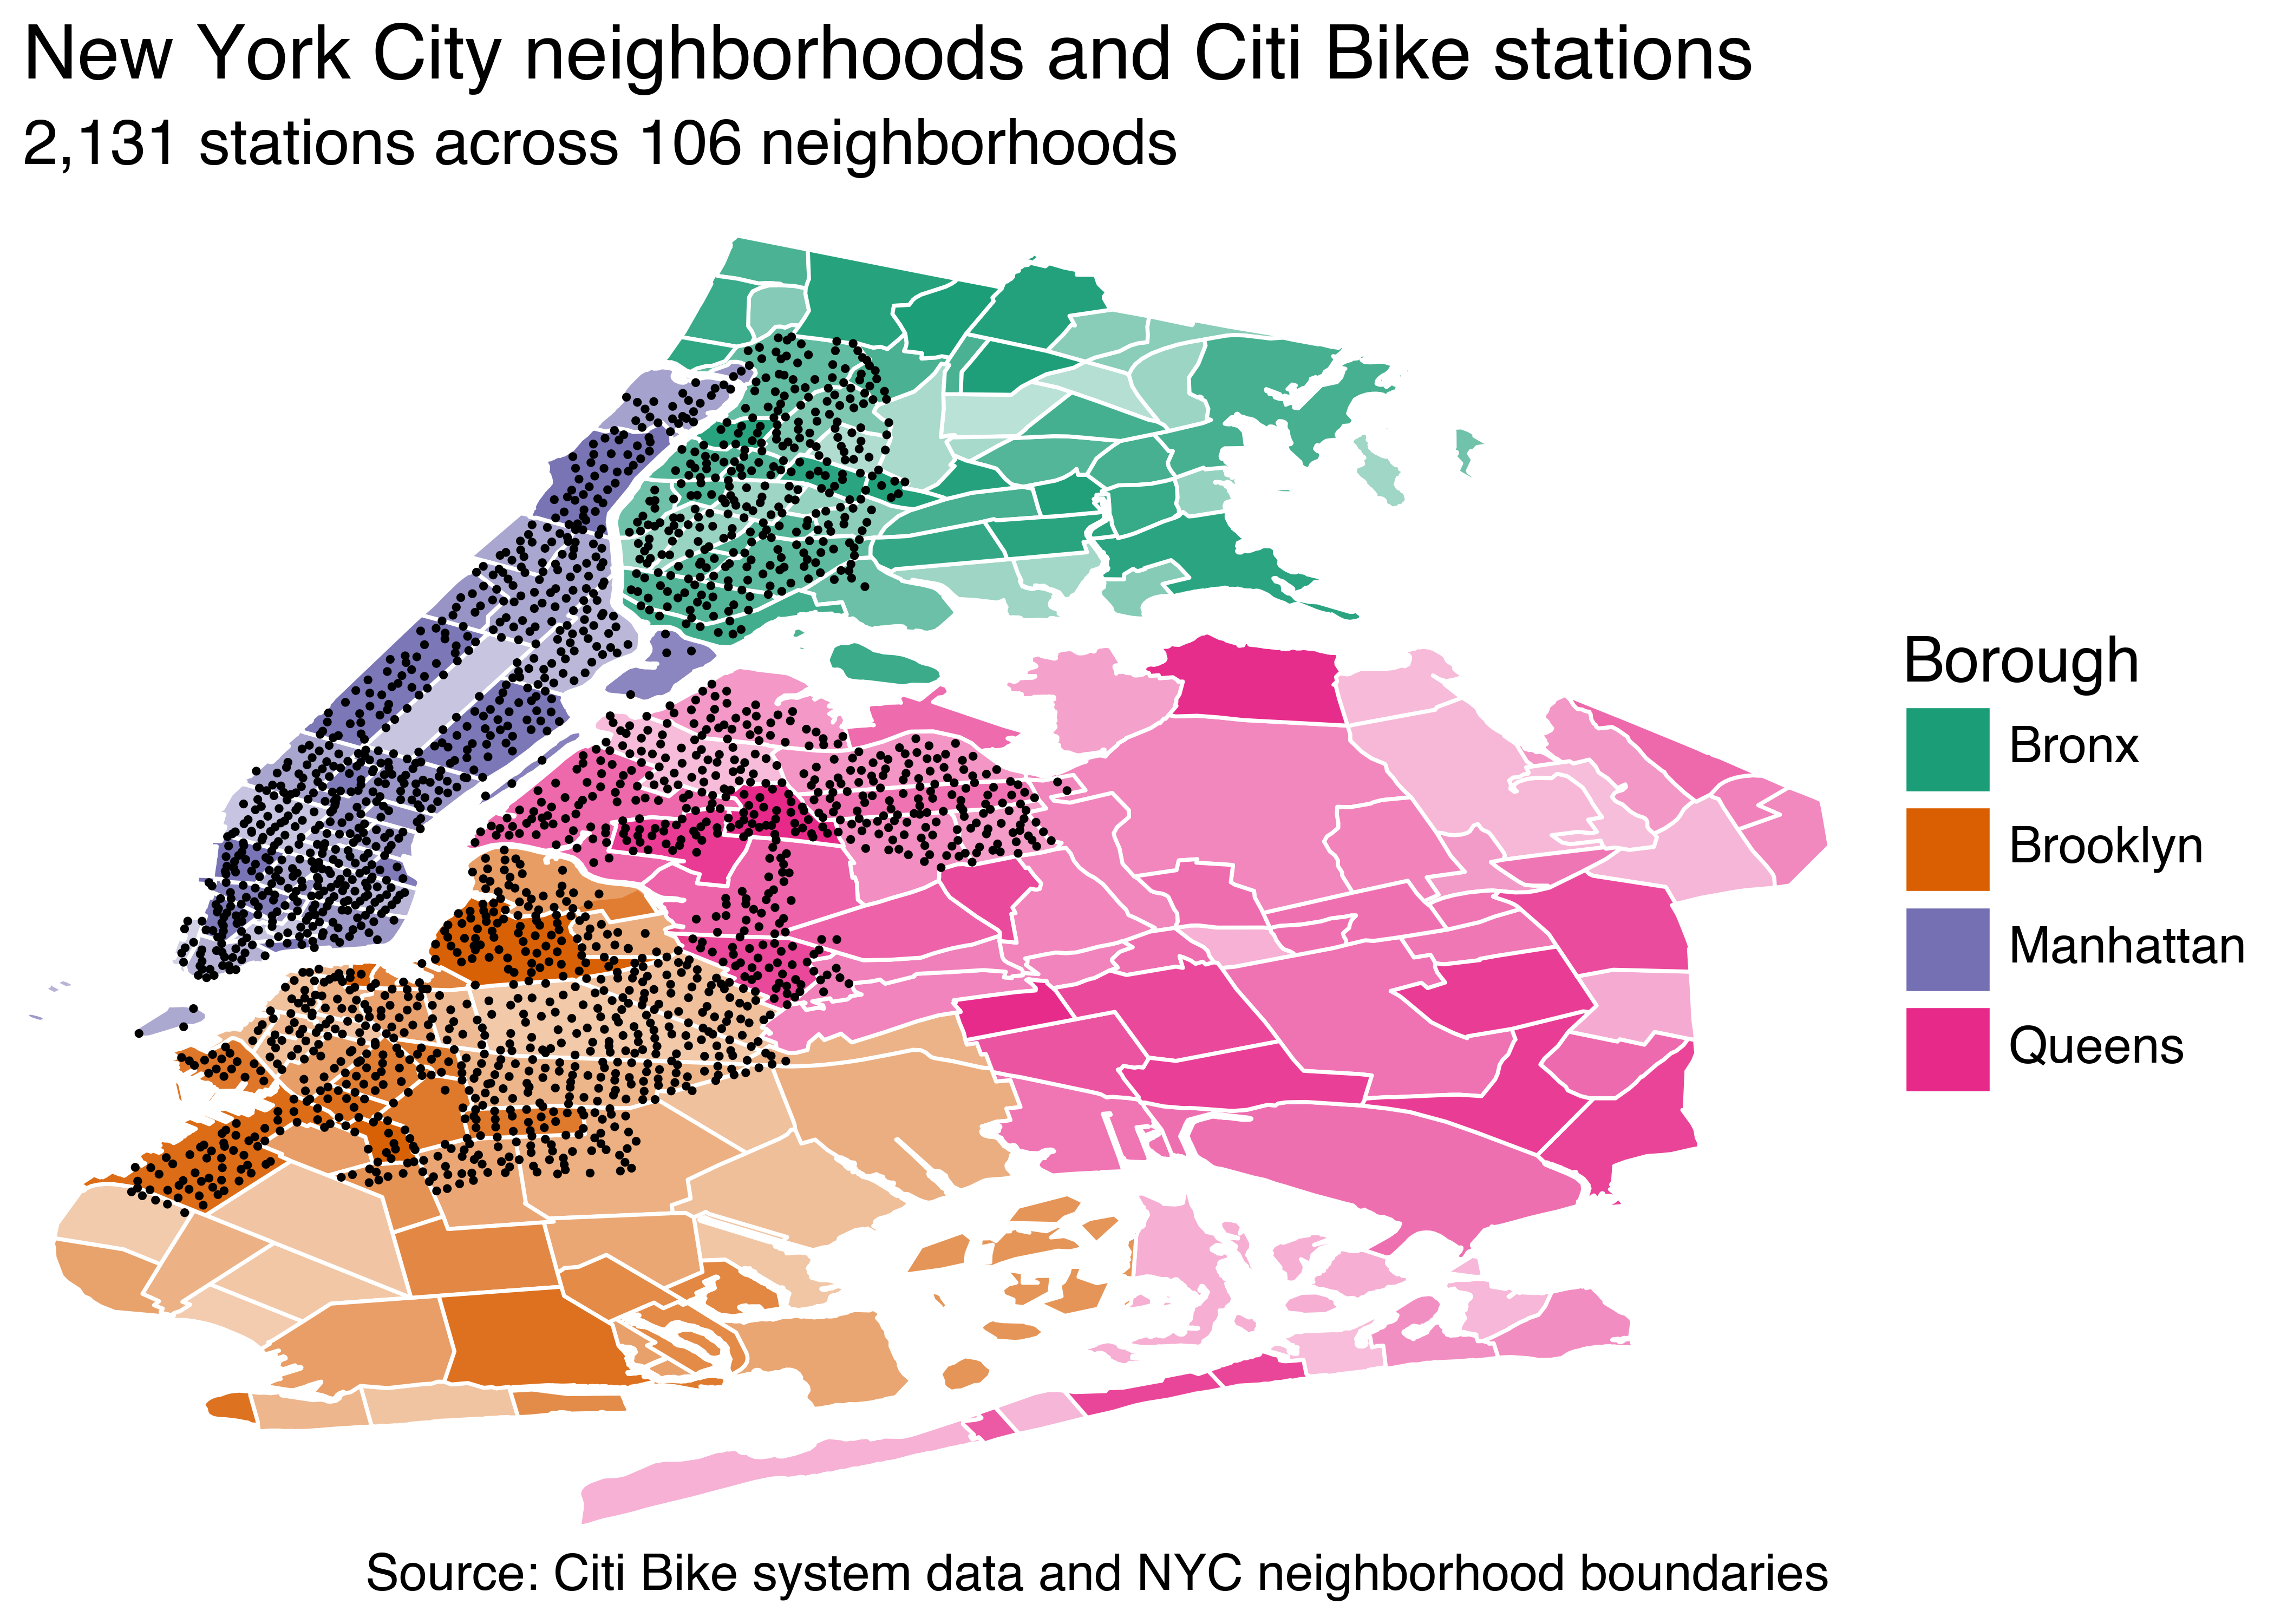
This page recreates the chapter 1 map of New York City neighborhoods and Citi Bike stations with plotnine_polars.
To keep the example focused on plotting, it uses compact parquet files for the polygon coordinates and station locations.
Read the data
neighborhoods_coords = pl.read_parquet("../data/nyc-neighborhoods-coords.parquet")
stations = pl.read_parquet("../data/citi-bike-stations.parquet")

print(neighborhoods_coords.head())
print(stations.head())
shape: (5, 5)
┌─────┬──────────────┬─────────┬────────────┬───────────┐
│ id ┆ neighborhood ┆ borough ┆ lon ┆ lat │
│ --- ┆ --- ┆ --- ┆ --- ┆ --- │
│ u32 ┆ str ┆ str ┆ f64 ┆ f64 │
╞═════╪══════════════╪═════════╪════════════╪═══════════╡
│ 0 ┆ Allerton ┆ Bronx ┆ -73.848597 ┆ 40.87167 │
│ 0 ┆ Allerton ┆ Bronx ┆ -73.845823 ┆ 40.870239 │
│ 0 ┆ Allerton ┆ Bronx ┆ -73.854559 ┆ 40.859954 │
│ 0 ┆ Allerton ┆ Bronx ┆ -73.854665 ┆ 40.859586 │
│ 0 ┆ Allerton ┆ Bronx ┆ -73.856389 ┆ 40.857594 │
└─────┴──────────────┴─────────┴────────────┴───────────┘
shape: (5, 3)
┌──────────────────┬────────────┬───────────┐
│ station ┆ lon ┆ lat │
│ --- ┆ --- ┆ --- │
│ str ┆ f64 ┆ f64 │
╞══════════════════╪════════════╪═══════════╡
│ 1 Ave & E 110 St ┆ -73.938205 ┆ 40.792327 │
│ 1 Ave & E 16 St ┆ -73.981656 ┆ 40.732219 │
│ 1 Ave & E 18 St ┆ -73.980544 ┆ 40.733876 │
│ 1 Ave & E 30 St ┆ -73.975361 ┆ 40.741457 │
│ 1 Ave & E 38 St ┆ -73.971822 ┆ 40.746202 │
└──────────────────┴────────────┴───────────┘Plot
(
    neighborhoods_coords.ggplot()
    .aes(x="lon", y="lat", group="id")
    .geom_polygon(aes(alpha="neighborhood", fill="borough"), color="white")
    .geom_point(data=stations, size=0.1)
    .scale_x_continuous(expand=(0, 0))
    .scale_y_continuous(expand=(0, 0, 0, 0.01))
    .scale_alpha_ordinal(range=(0.3, 1))
    .scale_fill_brewer(type="qual", palette=2)
    .add_guides(alpha=False)
    .labs(
        title="New York City neighborhoods and Citi Bike stations",
        subtitle="2,131 stations across 106 neighborhoods",
        caption="Source: Citi Bike system data and NYC neighborhood boundaries",
        fill="Borough",
    )
    .theme_void(base_size=14)
    .add_theme(
        dpi=300,
        plot_background=element_rect(fill="white", color="white"),
        plot_caption=element_text(style="italic"),
        plot_margin=0.01,
        plot_title=element_text(ha="left"),
    )
)