import polars as pl
import plotnine_polars
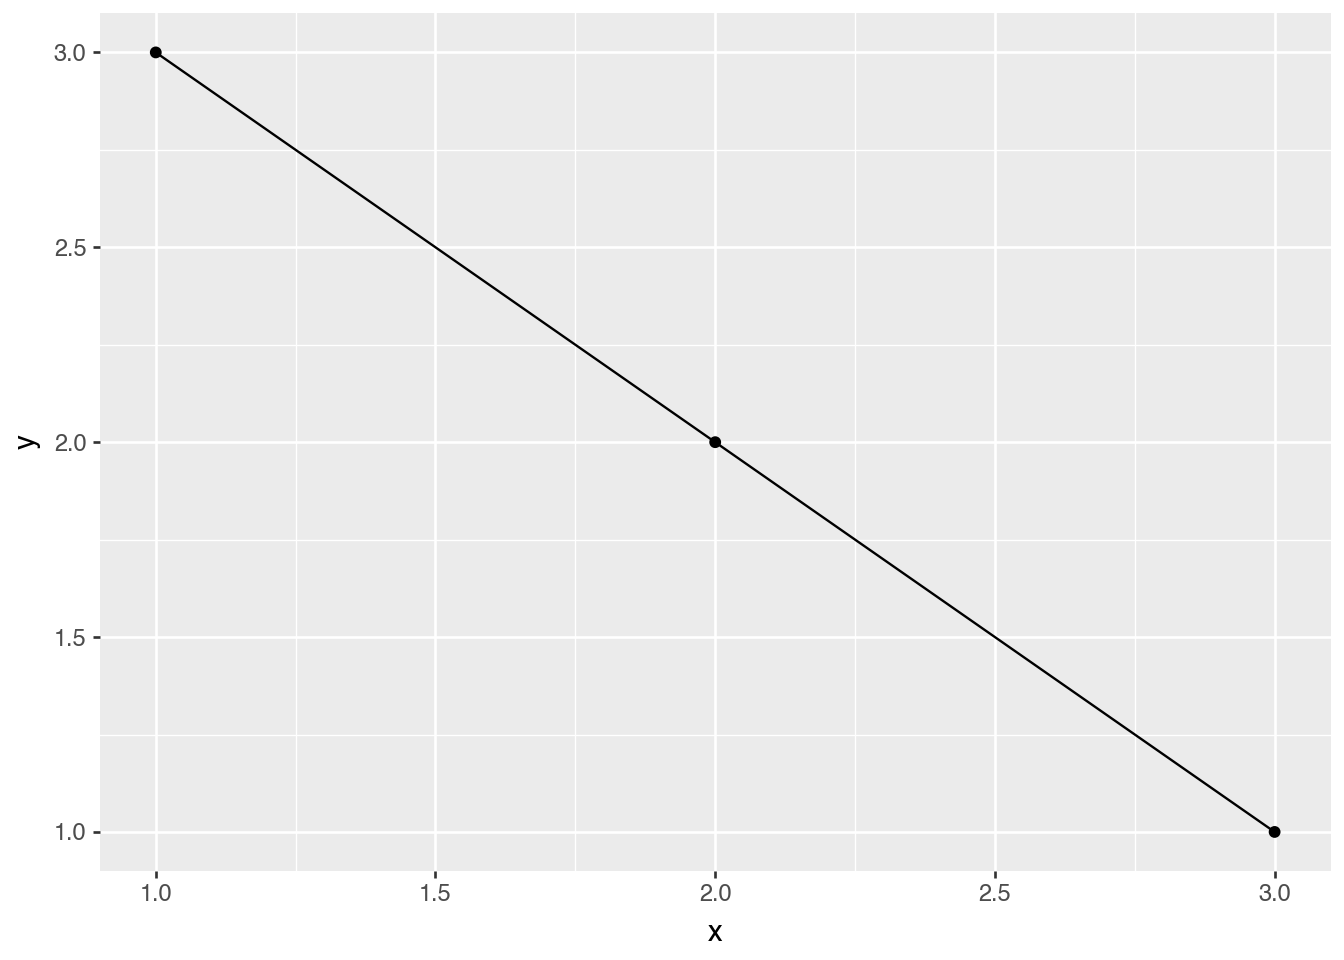
df = pl.DataFrame({"x": [1, 2, 3], "y": [3, 2, 1]})
(
df.ggplot()
.aes("x", "y")
.geom_point()
.geom_line()
)
plotnine_polarsThis site collects examples and guides for the plotnine_polars package.
The focus here is slightly different from the original site:
df.ggplot() where that reads naturallyplotnine_polars, not from a fork of plotnineImporting plotnine_polars registers the Polars dataframe namespace:
import polars as pl
import plotnine_polars
df = pl.DataFrame({"x": [1, 2, 3], "y": [3, 2, 1]})
(
df.ggplot()
.aes("x", "y")
.geom_point()
.geom_line()
)
Recreates Anscombe’s classic quartet with plotnine_polars, polars, and scikit-learn, including faceted regression lines and a polished final chart.
Shows how to add titles, subtitles, captions, and legend labels with plotnine_polars.
Builds a grouped bar chart step by step, using Polars for the data and layer-specific label mappings for the dodged text annotations.
Demonstrates facet_wrap(), facet_grid(), formula syntax, and free scales in a compact subplot-focused notebook.
Recreates the chapter 1 daily Citi Bike trips area chart with a compact, pre-aggregated dataset and the plotnine_polars API.
Recreates the chapter 1 neighborhood-and-stations map with compact parquet files and the plotnine_polars API.
Condenses the plotnine geoms guide into a notebook covering points, bars, rectangles, lines, ribbons, distributions, position adjustments, and summaries.
Focuses on global versus layer-local aes(), literal settings, grouping, and expression-based mappings.
Covers manual scales, breaks, labels, limits, legend merging, guide placement, and guide customization in the plotnine_polars style.
Most notebooks on this site are adapted from the official plotnine gallery and plotnine guides.