import polars as pl
import plotnine_polars as p9
from plotnine.data import mtcars
from plotnine_polars import aes7 guide_axis_theta()
guide_axis_theta() is a specialized guide for the theta axis in ggplot2 coord_radial() plots. It is not part of the plotnine 0.16.0 pre-release API.
The examples below are adapted from the ggplot2 reference page.
Note
The coord_polar() and coord_radial() functions are available in the plotnine pre-release, but guide_axis_theta() is not currently exported.
7.1 Base plot
The base plot uses coord_radial() to display theta tick labels on the outer edge of the circle. By default, Matplotlib renders each label horizontally.
mtcars_pl = pl.from_pandas(mtcars)

p = (
    mtcars_pl
    .ggplot(aes("disp", "mpg"))
    .geom_point()
    .coord_radial()
    .add_theme(figure_size=(5, 5))
)
p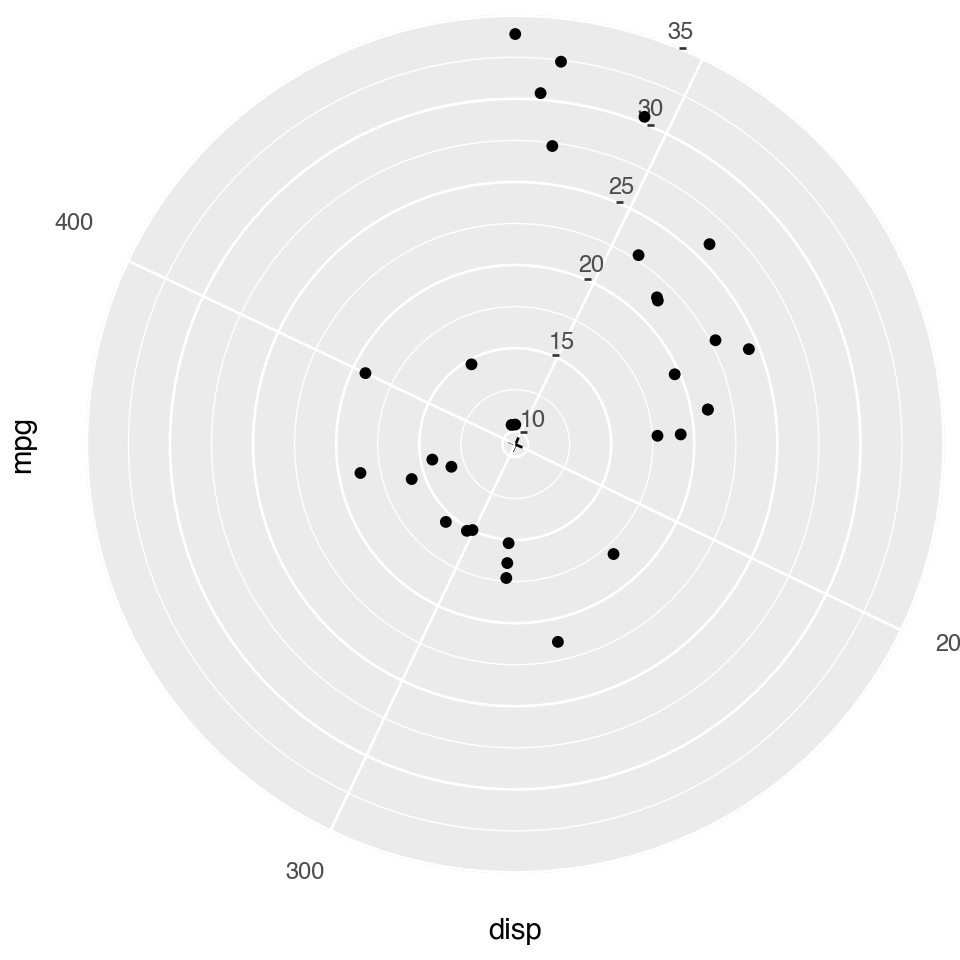
coord_radial() plot with theta labels
7.2 Label Rotation
The ggplot2 guide can rotate labels tangentially or radially. The equivalent guide is not available in plotnine 0.16.0a12, so those examples are omitted until the guide API exists.
7.3 Relationship between ggplot2’s angle and the tangent
The angle parameter is an offset from the tangential direction at each tick position, not an absolute rotation.
angle |
Label orientation |
|---|---|
0 |
Tangential, parallel to the arc (default ggplot2 heuristic) |
90 |
Radial, pointing outward from the centre |
-90 |
Radial, pointing inward toward the centre |
This matches ggplot2’s semantics, where the heuristics for waiver() also choose an angle relative to the arc direction. In contrast, Matplotlib’s default tick_params(labelrotation=N) sets an absolute angle, which is why this behavior needs a dedicated guide rather than a simple theme setting.
Note
The minor_ticks and cap parameters of ggplot2’s guide_axis_theta() are also unavailable in the plotnine pre-release.