library(tidyverse)
library(DBI)
library(scales)3 WRDS, CRSP, and Compustat
tidy_finance <- dbConnect(
  duckdb::duckdb(),
  "data/tidy_finance.duckdb",
  read_only = TRUE)
crsp_monthly <- tbl(tidy_finance, "crsp_monthly")
cpi_monthly <- tbl(tidy_finance, "cpi_monthly")
compustat <- tbl(tidy_finance, "compustat")crsp_monthly |>
left_join(cpi_monthly, by = "month") |>
group_by(month, exchange) |>
summarize(
mktcap = sum(mktcap/cpi, na.rm = TRUE),
.groups = "drop"
) |>
ggplot(aes(
x = month, y = mktcap / 1000,
color = exchange, linetype = exchange
)) +
geom_line() +
labs(
x = NULL, y = NULL, color = NULL, linetype = NULL,
title = "Monthly market cap by listing exchange in billions of Dec 2021 USD"
) +
scale_x_date(date_breaks = "10 years", date_labels = "%Y") +
scale_y_continuous(labels = comma)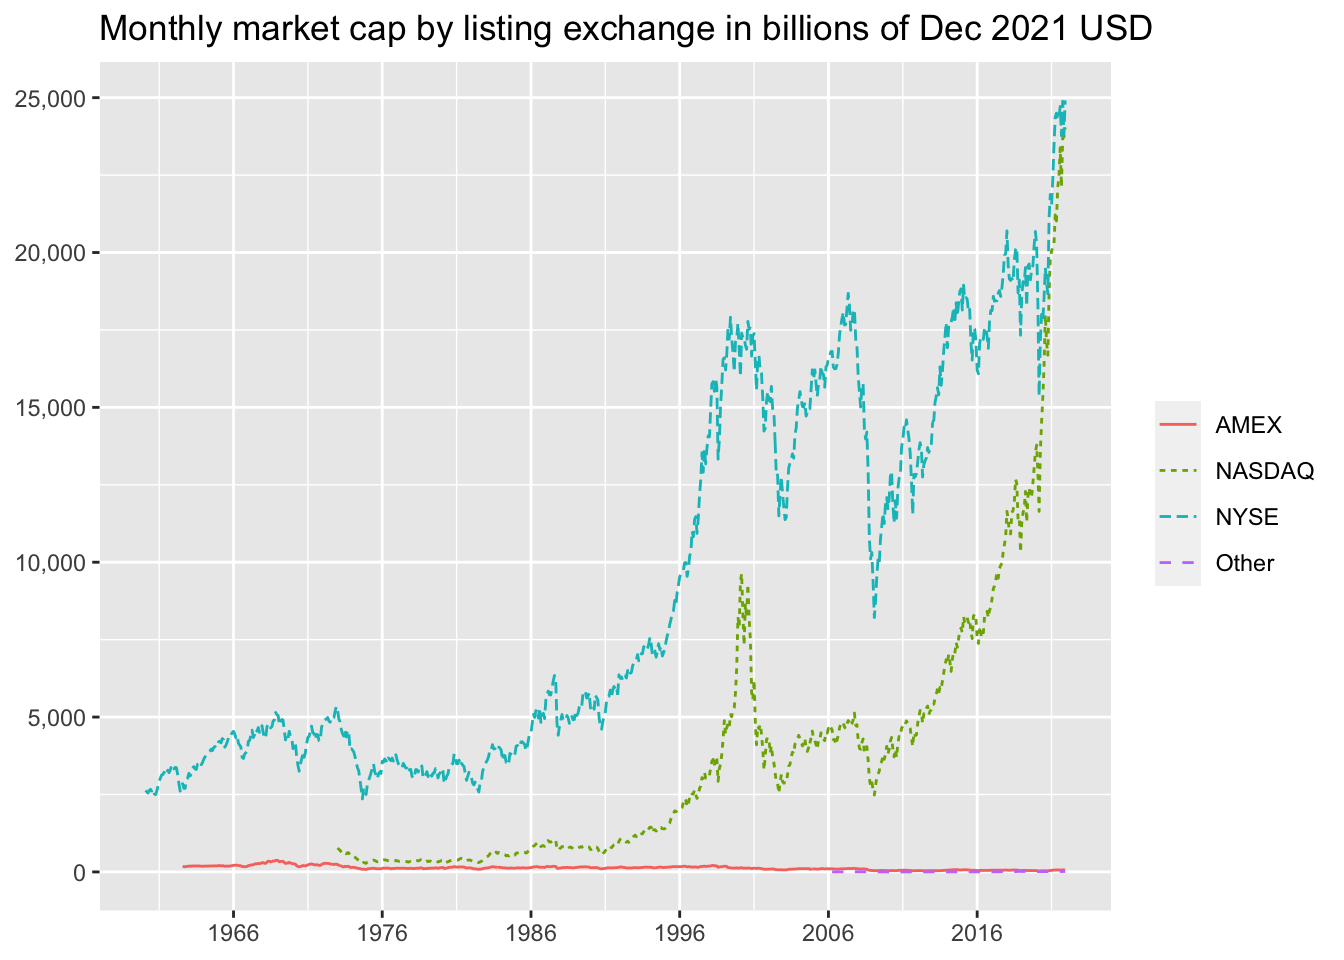
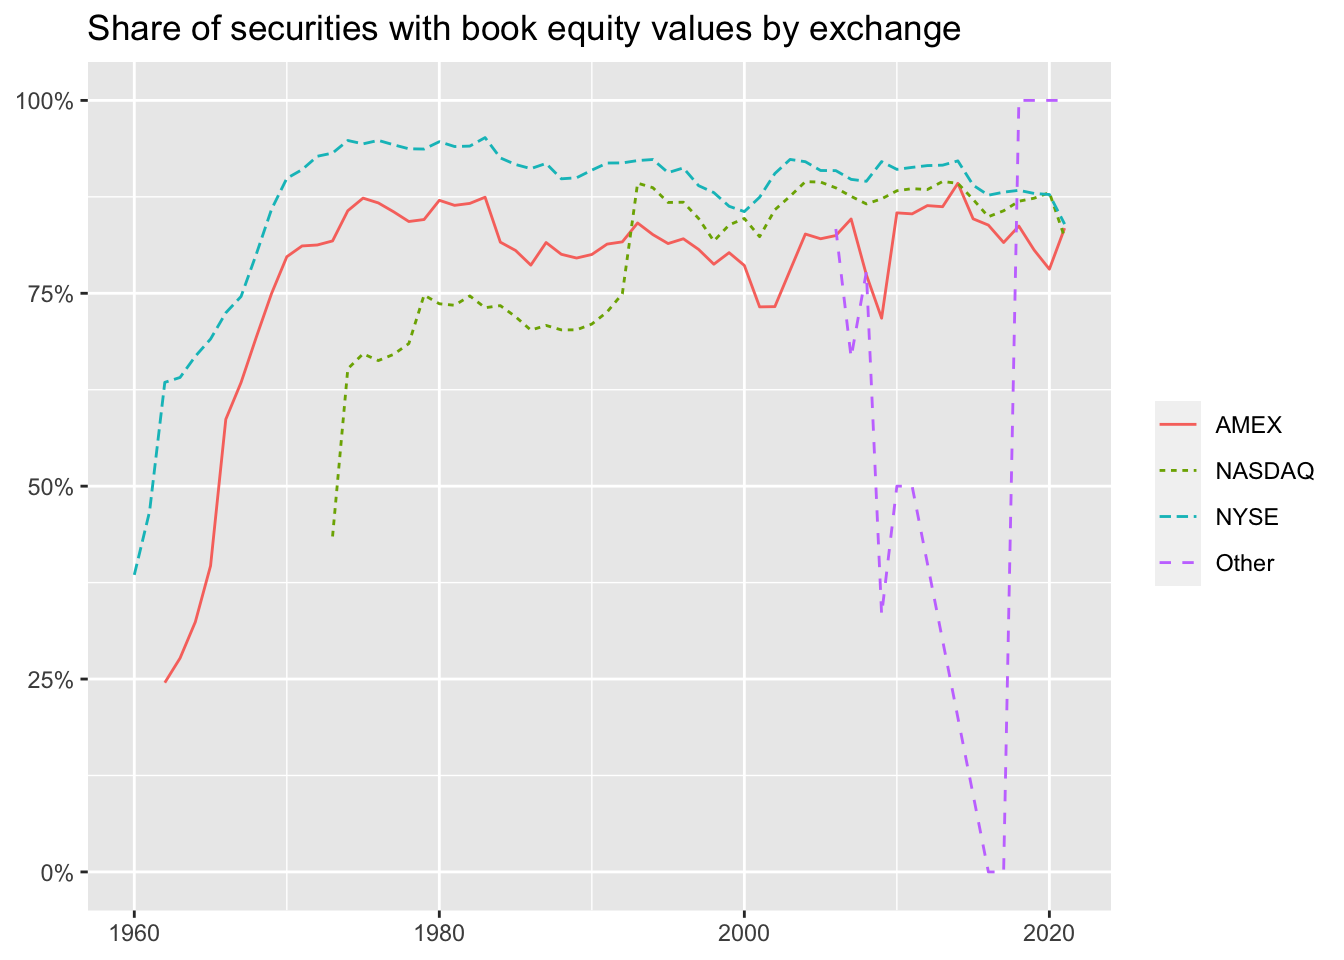
crsp_monthly |>
  group_by(permno, year = year(month)) |>
  filter(date == max(date)) |>
  ungroup() |>
  left_join(compustat, by = c("gvkey", "year")) |>
  mutate(permno_be = if_else(!is.na(be), permno, NA)) |>
  group_by(exchange, year) |>
  summarize(
    share = 1.0 * n_distinct(permno_be) / n_distinct(permno),
    .groups = "drop") |>
  ggplot(aes(
    x = year,
    y = share,
    color = exchange,
    linetype = exchange
  )) +
  geom_line() +
  labs(
    x = NULL, y = NULL, color = NULL, linetype = NULL,
    title = "Share of securities with book equity values by exchange"
  ) +
  scale_y_continuous(labels = percent) +
  coord_cartesian(ylim = c(0, 1))
Warning: Missing values are always removed in SQL aggregation functions.
Use `na.rm = TRUE` to silence this warning
This warning is displayed once every 8 hours.