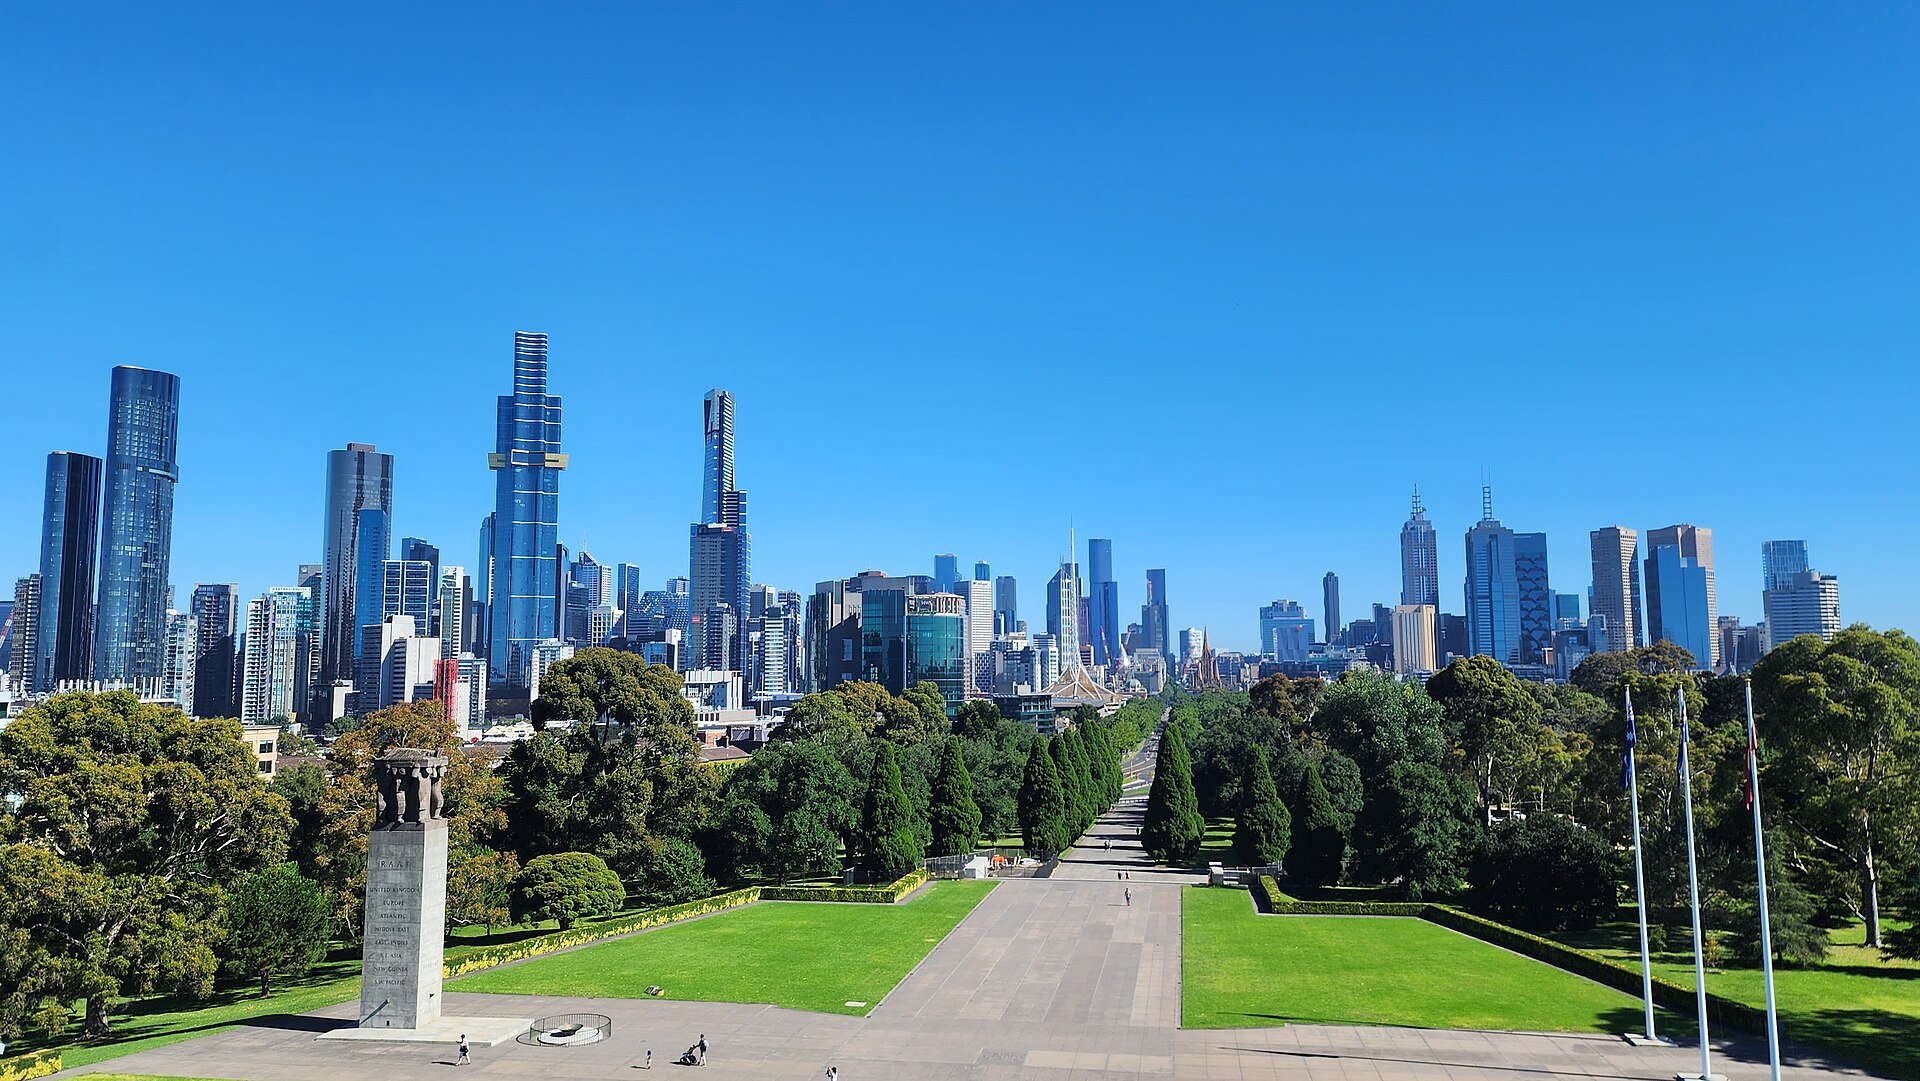
As I enter my penultimate month in Melbourne, I find myself looking out the window more often than usual. Staying on the edge of the CBD (the Australian term for “downtown” or “city centre”), I was reminded of something I have often wondered: Where would the Melbourne skyline rank among the cities of the United States on the basis of its skyline?
My intuition had told me that it would clearly fall behind New York and Chicago, but I found it difficult to think of a third-place US city that would outdo Melbourne’s skyline. (Note I am thinking in largely quantitative terms—the scale and scope of the skyline—not aesthetic ones.) LA? No. Miami? Nup. And so on.
But is there a meaningful way to measure skylines? A quick internet search turned up this ranking of the “most impressive skylines” in the US. This ranking uses two metrics: “skyscrapers taller than 150 meters” and “total height of skyscrapers taller than 150 meters”. Using either metric, New York is first and Chicago is second.1
Third place goes to Miami, with 42 skyscrapers over 150 metres and 7,251 metres on the second metric. Fourth is Houston, Texas, with 36 and 5,939. Los Angeles comes in fifth with 24 and 4,063. (I haven’t been to Houston in a long time, but my recollection is of multiple clusters of skyscrapers, so I wonder if this metric combines them all.)
But how do I get data for Melbourne? The linked article identifies its data source as The Skyscraper Center, which does have data on other countries including Australia. However, getting these would cost money, so I looked for a free source.
Fortunately, Wikipedia has a page listing tall buildings in Melbourne, and ChatGPT got me close to having code to scrape the data for analysis (see the original code). There are a few decisions to be made. First, which metric of height? Wikipedia offers two metrics: spire, which includes spires and architectural details but not antenna masts, and roof, the roof height reported in its table. I focus on the roof metric, as it is more conservative (i.e., lower). Second, what should I do with buildings at exactly 150 metres? I excluded the one building in Melbourne with a listed roof height of exactly 150 metres, using the strict condition roof_m > 150.
The punchline? With 76 buildings over 150 metres and a total roof height of 14,751 metres, Melbourne is well ahead of third-placed Miami in this table, but clearly behind Chicago (118 and 18,390 metres). My intuition is confirmed against these published benchmarks: Melbourne would slot into third place.
Reproducing the Melbourne numbers
The code below uses a small CSV snapshot extracted from the Wikipedia revision of 18 August 2025, the latest revision before I posted the original article. Keeping that snapshot makes the calculation reproducible as the live page changes.
The total is 14,750.8 metres, rounded to 14,751 in the original post. The download script recreates this CSV from the fixed Wikipedia revision. It caches the response under RAW_DATA_DIR/skylines/ and writes the processed CSV under DATA_DIR/skylines/. The snapshot supplied with this note lets you run the analysis without downloading the page again.
The comparison
Table 1: Melbourne alongside the five US benchmarks used in the original post
City
Buildings
Total height (metres)
Source
New York City
256
50,208
Stacker, April 2018
Chicago
118
18,390
Stacker, April 2018
Melbourne
76
14,751
Wikipedia, August 2025
Miami
42
7,251
Stacker, April 2018
Houston
36
5,939
Stacker, April 2018
Los Angeles
24
4,063
Stacker, April 2018
There are limits to the comparison. The two sources describe different dates, and I have retained the US totals as Stacker reported them. The Melbourne calculation uses roof heights and a strict cutoff; Stacker’s introduction describes buildings at or above 150 metres and cites The Skyscraper Center, whose standard rankings use architectural height, including spires. Roof height is also distinct from height to the highest occupied floor. A comparison for a common date would require reconciling these choices and the geographical boundaries of each city.
The data-source record documents the original post, code, data revisions, and photograph attribution. The source for this note is available on GitHub.
Footnotes
The Stacker article was published on 2 April 2018. The comparison here uses its published US figures alongside the Melbourne data available in August 2025.↩︎