The case of Costco’s 2025 10-K filing
The accession number for Costco’s 2025 10-K filing is 0000909832-25-000101. Table 2 shows some selected data from sub_notes for this filing. Looking at accepted in Table 2 causes me to wonder if a filing after 9pm EDT is normal for Costco. As it is quite trivial to address this question using the dera.pq data, I create Table 3. From Table 3, it does seem that most filings are after standard business hours for the US East Coast (Costco is headquartered in the US/Pacific time zone), but rarely as late as 9pm EDT.
Table 3 also includes lag, which is the time (in days) between period and accepted. Interestingly, there’s no clear pattern to lag over time, though it does appear to be trending downwards and to vary from one year to the next.
Presentation data
I now turn to the pre_notes table, which provides information about the presentation of XBRL data in the associated SEC filing. The variable stmt describes the statement to which each row of the data relates. Table 4 provides information about the distribution of this variable across all 10-K filings on the DERA Notes data.
As might be expected, most data items are not associated with any statement (i.e., stmt is NA), presumably because they are contained in the footnotes to the financial statements. Comparing Table 4 with Table 1 confirms that the vast majority of 10-K filings have all four core financial statements (i.e., BS, CF, IS, and EQ) on pre_notes. Further research would be required to understand whether the cases without one or more of these financial statements can be attributed to the absence of these statements in the filings, absence from the XBRL data supplied with the filing, or some failure in the extraction of the data into the pre_notes data supplied with DERA Notes.
The fields I use from pre_notes are adsh, line, tag, plabel, prole, and negating. To better understand the content of pre_notes, I present a sample of the underlying data in Table 5 ordered by line (for reasons of space, I omit adsh; it is always 0000909832-25-000101 here). As can be seen there, each line is associated with a tag and negating will be used to handle the values I get from cal_notes in later tables.
For my analysis here, the only use I make of prole is to filter out the difficult-to-handle row where prole equals “periodStartLabel”.
Due to space constraints, I present plabel values in a separate table Table 6. The SEC DERA documentation describes plabel as “the text presented on the line item, also known as a ‘preferred’ label”. That plabel is a little more human-readable can be seen in Table 6.
Numeric data
The num_notes table contains numeric data, one row per data point in the financial statements and the notes thereto. Table 7 provides a sample of such data related to Costco’s 2025 statement of cash flows. Note that the values in uom (the unit of measure) do not vary within this Costco data set. However, qtrs does vary: while most items on Costco’s statement of cash flows have qtrs equal to 4, the value of qtrs for beginning and ending balances of cash and cash equivalents equals 0, as these are point-in-time balances.
Note that I filter for iprx == 0, where iprx is “a positive integer to distinguish different reported facts that otherwise would have the same primary key. For most purposes, data with iprx greater than 1 are not needed.” I also filter for dimn == 0, as values with dimn greater than zero in this context represent segment data.
Table 7 also includes data on datp. According to the DERA Notes documentation datp represents “the difference between the reported fact date and the month-end rounded date (ddate), expressed as a fraction of 1. For example, a fact reported for 29/Dec, with ddate rounded to 31/Dec, has a datp value of minus 2/31 = -0.0645.” This provides a nice illustration of the reality that, pace the views of RTFM proponents, one should not always trust what one Reads in The Flaming Manual. If you look at the 10-K for Costco, you will see references to “August 31, 2025” (i.e., 0 days before 31 August), “September 1, 2024” (-1 days before 31 August), and “September 3, 2023” (-3 days before 31 August) and these values line up with datp representing the number of days between the fiscal year-end and the month-end (31 August). The field tdate in Table 7 is not actually a field in num_notes, but is a column I calculate using ddate and datp.
Finally, the column dcml indicates the decimal precision of the value column, with -6 meaning the data are reported in millions of the units in uom (i.e., USD).
Merged data
Now that we understand the data in pre_notes and num_notes, we can merge the data for Costco’s 2025 10-K to produce Tables 8–11. I merge data from pre_notes with data from cal_notes using adsh and tag as the linking variables.
I present the data from Costco’s 2025 statement of cash flows over several tables partly for reasons of space, starting with cash flows from operating activities in Table 8. I scale the data by dividing the values by one million and I multiply any value where negating is true by minus one.
From Table 7, it can be seen that the num_notes data are in a long form with ddate arranged in a single column, while the typical presentation of statements of cash flows will have the dates organized as columns. Therefore I use the pivot_wider() function to reorganize the data for presentation.
Table 8 presents the first 12 lines of the merged data set, which relate to cash flows from operating activities. Costco’s cash flows from operating activities are larger than net income—due to the add-back of depreciation and amortization—and growing.
Table 9 presents the next six lines of the merged data set, which relate to cash flows from investing activities. The largest item is capital expenditure (“additions to property and equipment”). That capital expenditures are roughly double depreciation and amortization suggests that Costco is, despite its maturity, still a growing firm.
For reasons I would need to explain in a different note, for standard financial analysis purposes, cash flows would generally be categorized as either operating or financing, with investing cash flows for GAAP purposes relating either to operating activities (e.g., capital expenditures) or to financing activities (e.g., the purchase or sale of short-term investment securities).
A rough-and-ready measure of free cash flows can be calculated by subtracting capital expenditures from cash flows from operating activities. I say rough-and-ready because a more refined measure would do a better job of separating financing cash flows from operating cash flows. For example, it might be appropriate to view the tax withholding on stock-based awards or some portion of the financing lease payments—see Table 10—as operating cash flows despite their classification as financing cash flows in US GAAP. It is also probably appropriate to view the interest paid—see Table 11—as financing, not operating, as it is considered in US GAAP. Similarly, some portion of the income taxes paid could be allocated to financing (e.g., the tax savings on interest).
In the case of Costco, the small amount of interest paid means that the rough-and-ready measure will be quite close to a more refined measure.
Calculation data
Finally, I turn to the data in cal_notes, which has the fields adsh, grp, arc, negative, ptag, pversion, ctag, and cversion. Table 12 provides a sample of observations from that table for Costco’s 10-K filing. It turns out that rows with grp equal to 7 relate to the income statement, those with grp equal to 9 relate to the balance sheet and those with grp equal to 14 relate to the statement of comprehensive income. The rows related to the statement of cash flows have grp equal to 3. These rows are shown in Table 13.
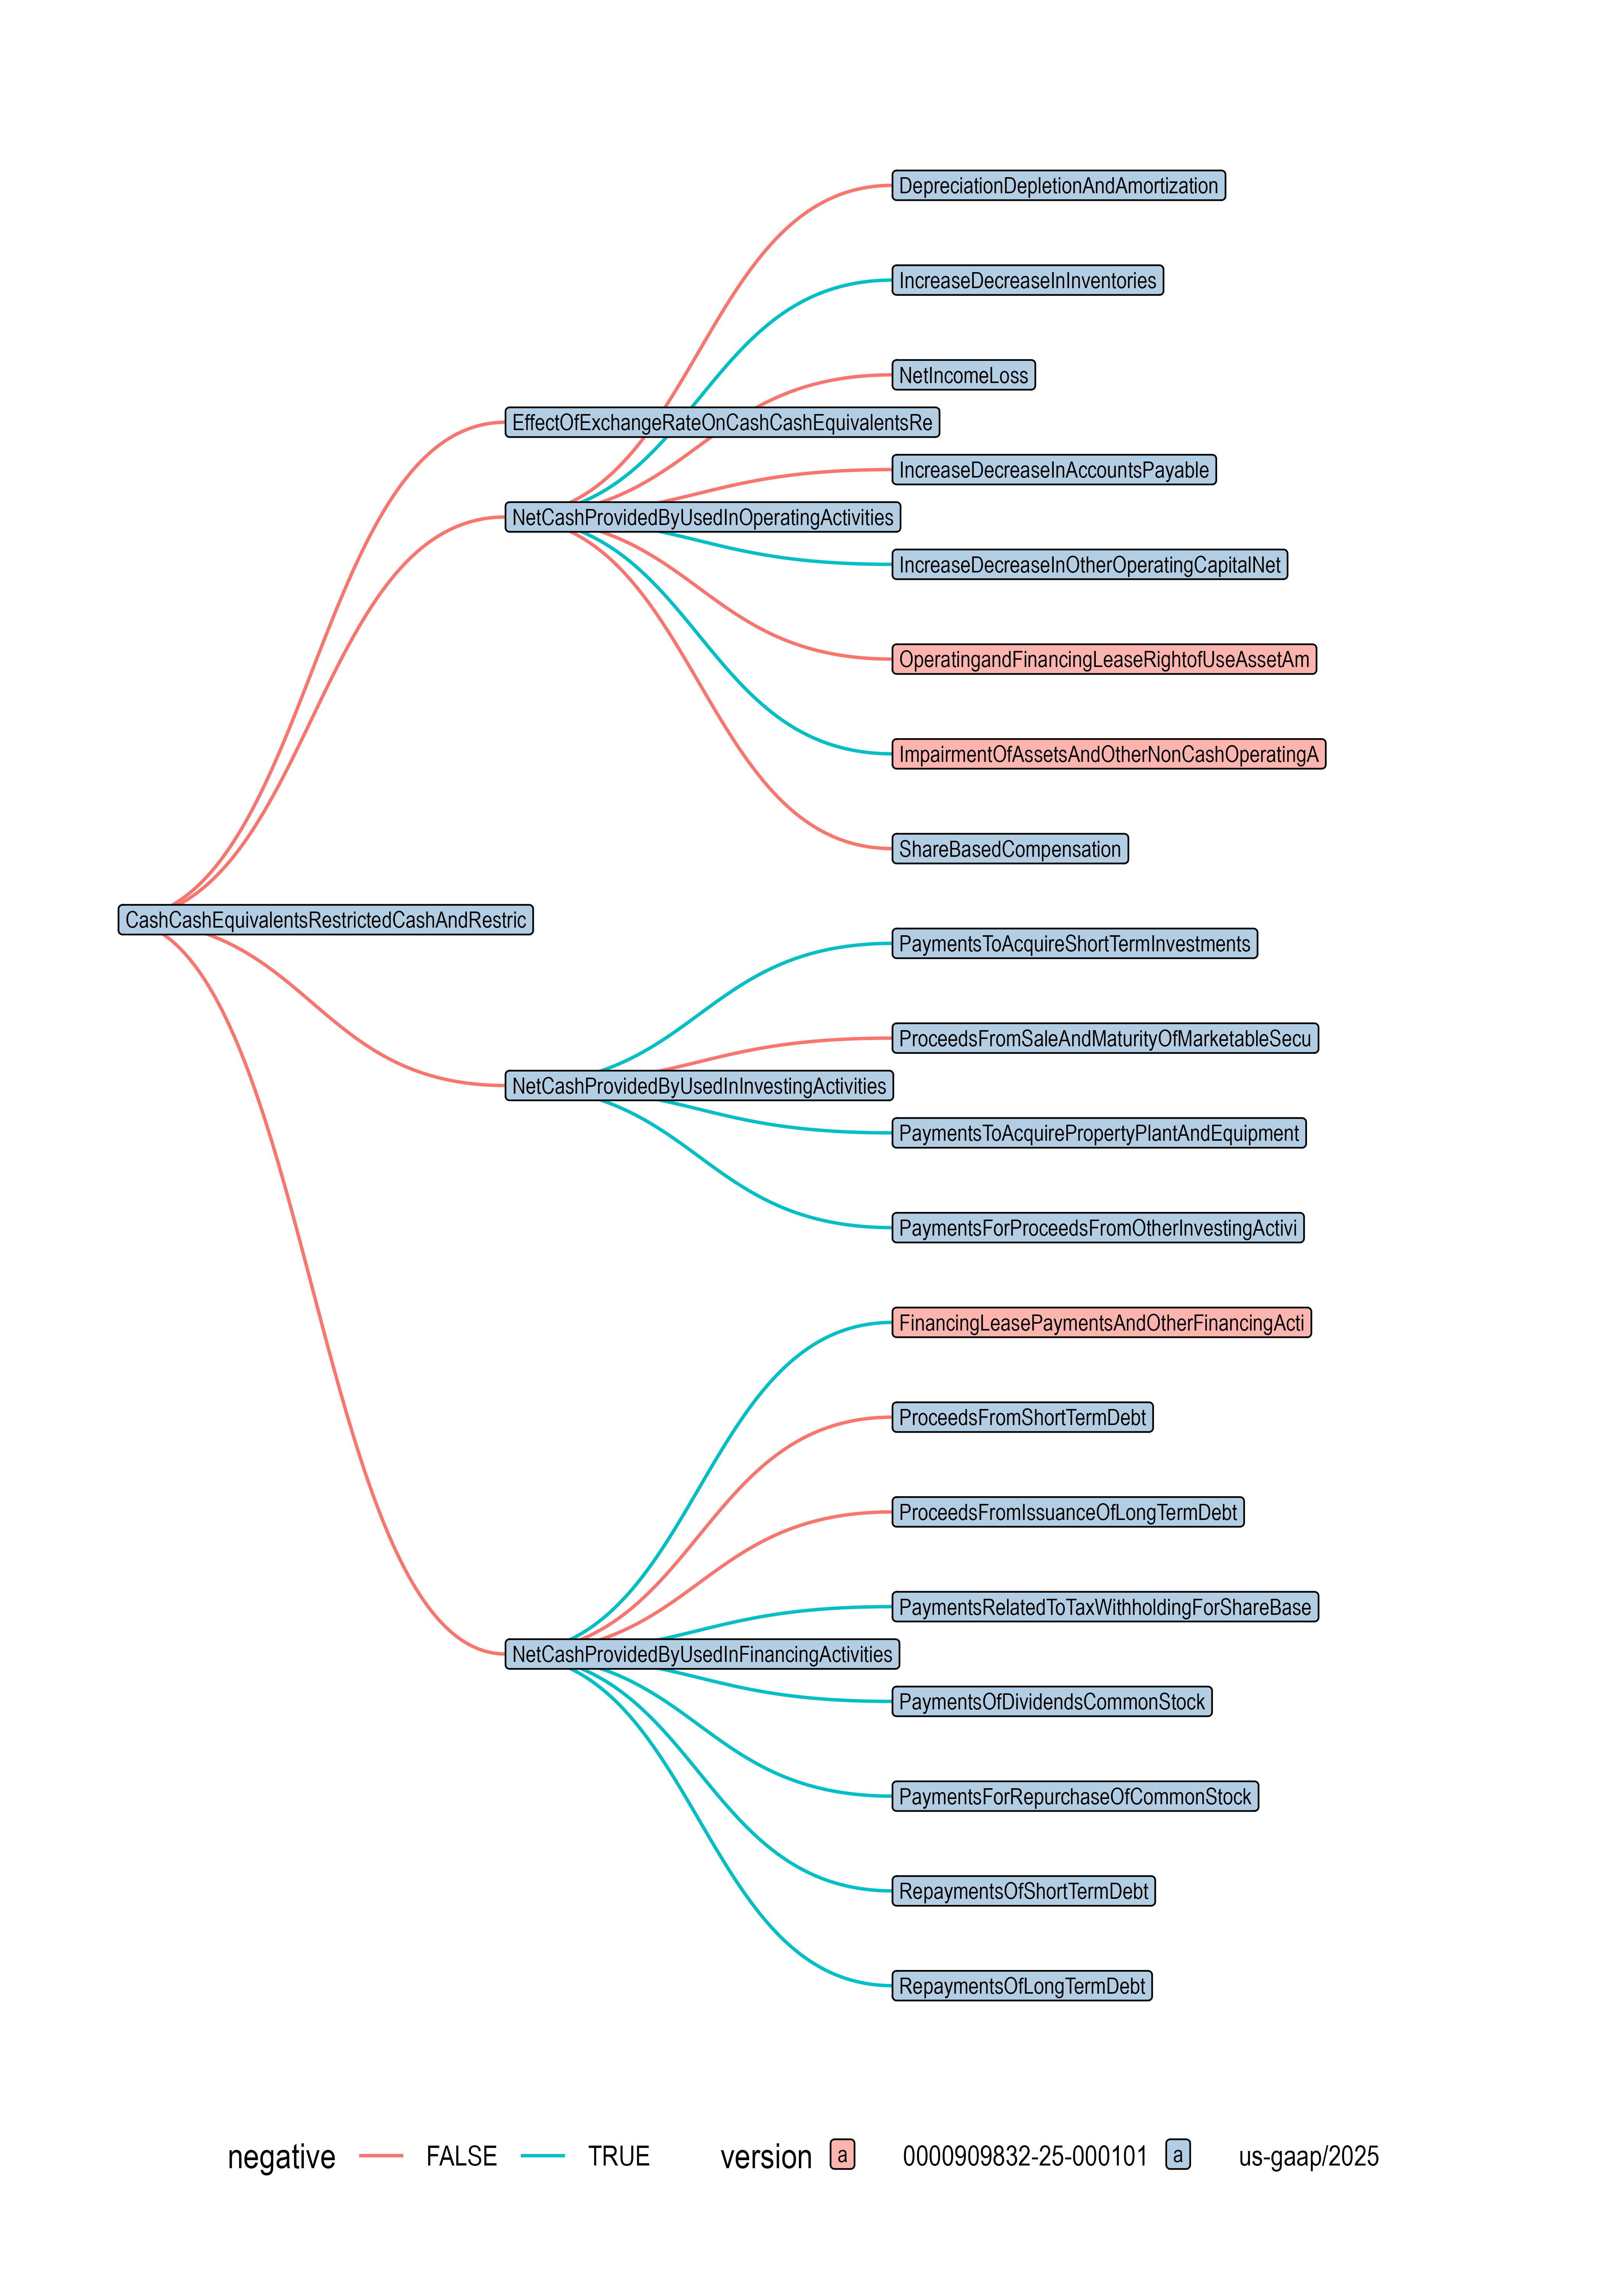
From Table 12 and Table 13, it should be clear that the data in cal_notes describe a hierarchy of calculations, with ctag representing an item that is a “child” of the item represented by ptag (i.e., “parent tag”). I represent the hierarchy embedded in Table 13 in Figure 1.
In some ways, the calculation hierarchy in Figure 1 resembles a typical statement of cash flows, with an overall change in cash sitting at the root of the tree as the parent of the tags representing cash flows from operating activities, investing activities, financing activities and the effect of exchange rate changes. This second level of the tree then has child nodes representing more detailed cash flow items. Each item can be aggregated up the tree to produce the cash flow totals at the higher levels, with due note being taken of negative in doing so.
Looking at Figure 1, we can see also that Costco uses three custom tags in its cash flow calculations. In each case, it seems Costco has combined multiple standard taxonomy items into a single line. FinancingLeasePaymentsAndOtherFinancingActivitiesNet seems to combine FinanceLeasePrincipalPayments, which covers the principal portion of finance lease payments, and “other” financing cash flows. ImpairmentOfAssetsAndOtherNonCashOperatingActivitiesNet combines AssetImpairmentCharges and some catch-all item like OtherNoncashIncomeExpense. OperatingandFinancingLeaseRightofUseAssetAmortization presumably combines amortization of both operating and financing leases.
While it seems clear that Costco has used custom tags to combine multiple standard taxonomy items to align with its chosen presentation in the statement of cash flows, the use of custom tags does have the unfortunate effect of making it more difficult to compare the cash flow data across firms, as other firms may not make the same presentation choices and therefore may use standard US GAAP tags or use different custom tags. In cases like this, perhaps the better approach would be to require the use of standard tags at a lower level but allow firms to aggregate amounts using custom tags purely for presentation purposes.
Population analysis
Now that we have a better understanding of the data from examination of Costco’s statements of cash flows, I move on to an analysis of the broader population of 10-K filings on DERA Notes.
Calculation data
Recall that my goal is the classification of the operating portions of statements of cash flows based on tags used for operating cash flows in the XBRL data available in DERA Notes. For filings like that provided by Costco’s 2025 10-K filing, it seems that using the data in cal_notes will provide the most reliable approach. In effect, all I have to do is to start at the top of the hierarchy of calculation relationships and then work down to identify the tag that represents cash flows from operating activities and then to identify the tags that are children of that tag in the calculation hierarchy.
Once I have identified the tags representing cash flows from operating activities, it should be fairly straightforward to link specific tags to either the direct-method presentation or the indirect-method presentation.
For this reason, my approach to classifying the presentation method of each filing prioritizes cal_notes data where available and reliable.
Unfortunately, not all filings have cal_notes data and, of those that do, not all have a cal structure that is regular enough to allow for the reliable identification of the operating-section leaf-node tags.
Table 14 provides periods from 2009 through 2025 and filings on Form 10-K. On the basis of Table 14, I focus on periods between 2014 and 2025, because earlier filings do not reliably include cal_notes data and 2026 is incomplete at the time of writing.
Table 15 provides information on the regularity of the structure for filings with available cal data. Using recursive common table expressions (CTEs), I create trees for each filing on cal_notes and classify the structure of the cal_notes data for each filing as either regular or irregular, with regularity defined in terms of the presence of an operating cash flow node alongside nodes for investing and financing cash flows.
For filings classified as regular in Table 15, I use operating-section leaf-node tags identified through the cal_notes linkbase to determine the reporting method, as shown in Table 16.
Presentation data
For the remaining filings—those lacking cal_notes data or with irregular cal_notes data—I fall back on pre_notes data, applying the same tag-based direct- versus indirect-method classification to all cash flow statement tags on pre_notes. A filing is unclassifiable under this approach if none of its cash flow tags are recognisable as either direct- or indirect-method tags. Table 17 reports the results of this pre_notes-based classification; the “No cal data” and “Irregular” columns match the corresponding entries in Table 14 and Table 15, respectively.
Table 19 shows that almost all 10-K filings have some data on pre_notes. However, a small percentage of 10-K filings have no data for one or more of the key statements: balance sheet (“No BS data”), income statement (“No IS data”), or cash flows (“No CF data”). The “No FS data” indicates the number of cases where there is no data on pre_notes for any of these three key financial statements. Table 19 also suggests that the availability of filings on pre_notes is high from 2011 onwards, apart from a blip in 2013. The 2026 data cover only part of the year, so relatively few firms have filed 10-Ks for periods ending in calendar 2026.
From Table 20, we see that there are 706 filings with no CF data on pre_notes during the period I focus on (2014–2025). All of the cases are either irregular or no-cal filings, so they fall within the 971 unclassifiable cases in Table 17. For these filings, with no usable data from either cal_notes or pre_notes, there is no systematic basis for classification.
Overall classification results
Table 18 combines the data from Table 17 and Table 15 to show the overall distribution of direct- and indirect-method filers by year.
Table 21 and Table 22 identify the most common tags for direct-method and indirect-method statements of cash flows, respectively. These tables confirm that these tags are disjoint sets.
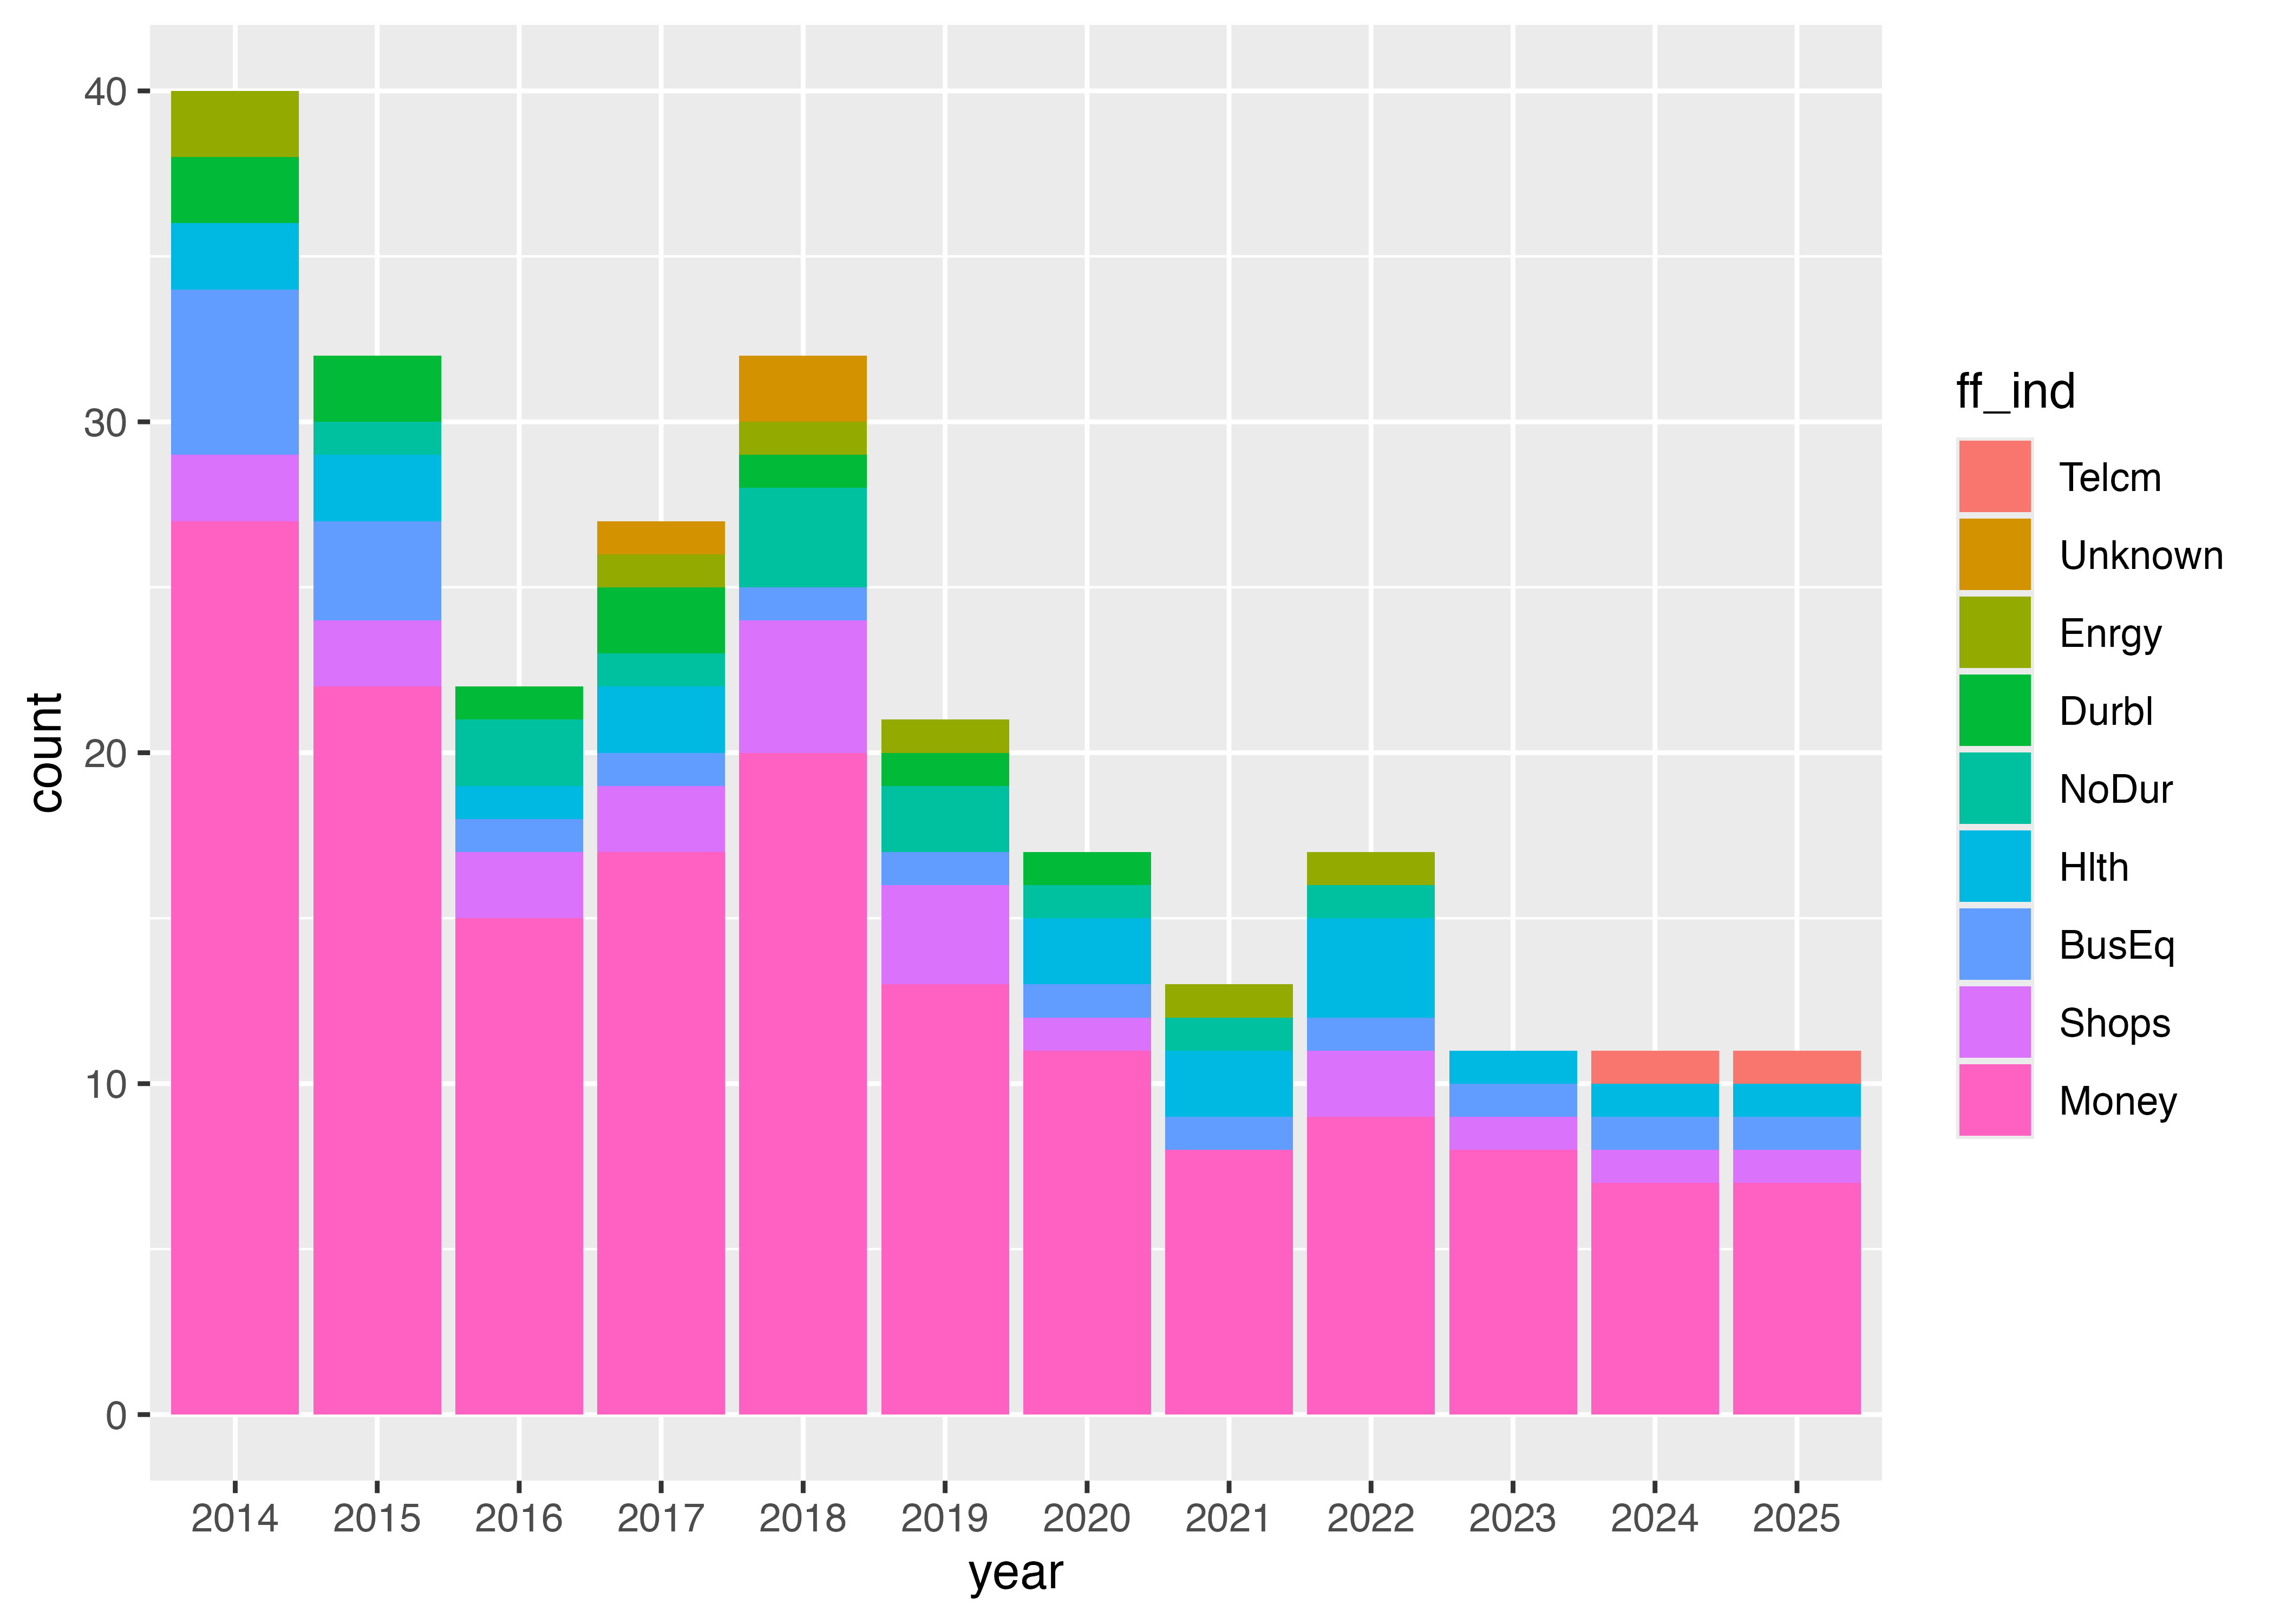
Figure 2 presents trends on direct-method filers over time in a graphical form. Interestingly, the largest group of direct-method filers are in the Fama-French 12-industry group labelled “Money”, which includes banks and insurance companies where cash flow analyses are often considered less useful.
Table 23 identifies those few firms who filed direct-method statements of cash flows for 10-Ks filed for periods ending in 2025.